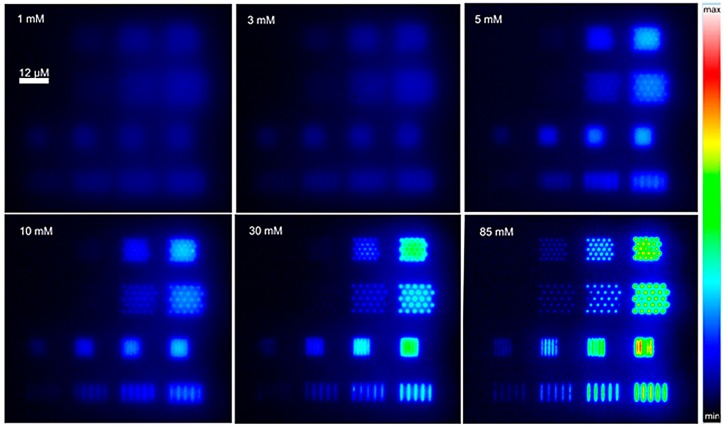
Figure 10.
ECL images of a BDD-NEA obtained in phosphate buffer (pH 7.4) containing 1 mM Ru(bpy)32+ and increasing concentrations of TPrA (indicated in top-left corner of each box). Images were recorded in the dark with a ×50 objective when applying a constant potential of 1.2 V vs. Ag/AgCl/KCl. All images were coded according to the same false colour scale (right) (reprinted with permission from [88]).

