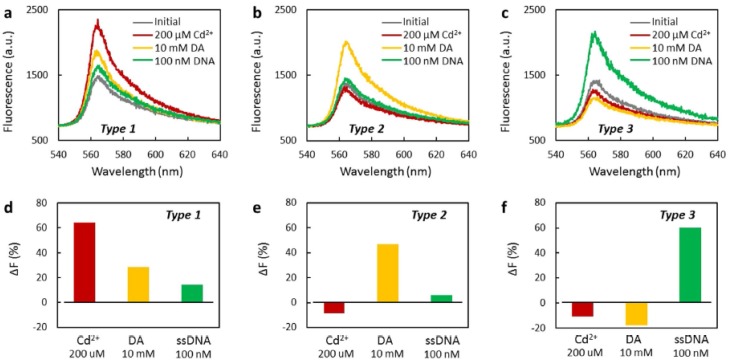
Figure 15.
Fluorescence spectra of Type 1 (a), Type 2 (b) and Type 3 (c) sensor when immersed in 200 μM Cd2+ (red curve), 10 mM DA (yellow curve) and 100 nM (green curve).(d–f), Histograms: the fluorescent restoration ratio of Type 1 (d), Type 2 (e) and Type 3. Reprinted from [142] under a Creative Commons CC-BY license.

