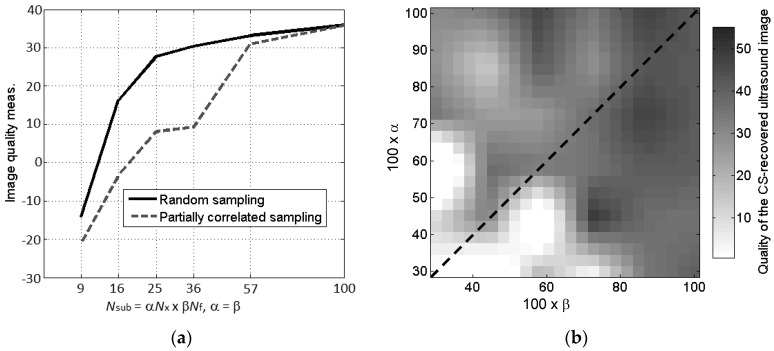
Figure 8.
(a) Comparison of the CS-TV image quality defined by Equation (12) for the two sampling schemes; (b) Image quality analysis (0-white meaning bad performance, and 1-black meaning good performance) of the CS image quality for different number of frequency and spatial samples (partial random sampling). Dashed line denotes the same number of frequency and spatial samples.

