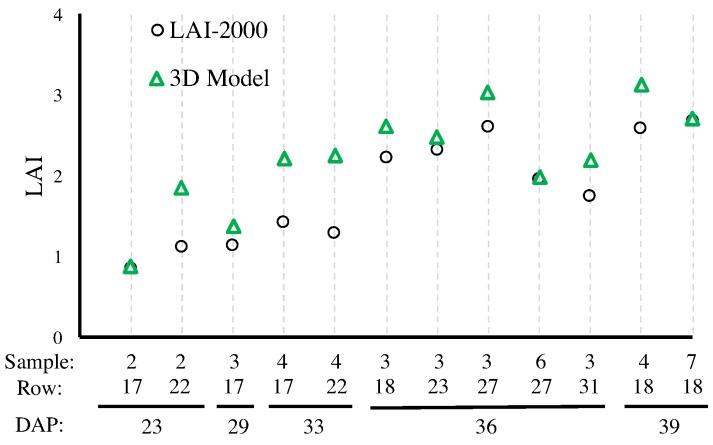
Figure 8.
Comparison of LAIs obtained by LAI-2000 and Vinobot using 3D reconstruction of the leaves. The horizontal axis shows the number of samples collected per row; the row number from Figure 5; and the days after planting (DAP) for each observation.

