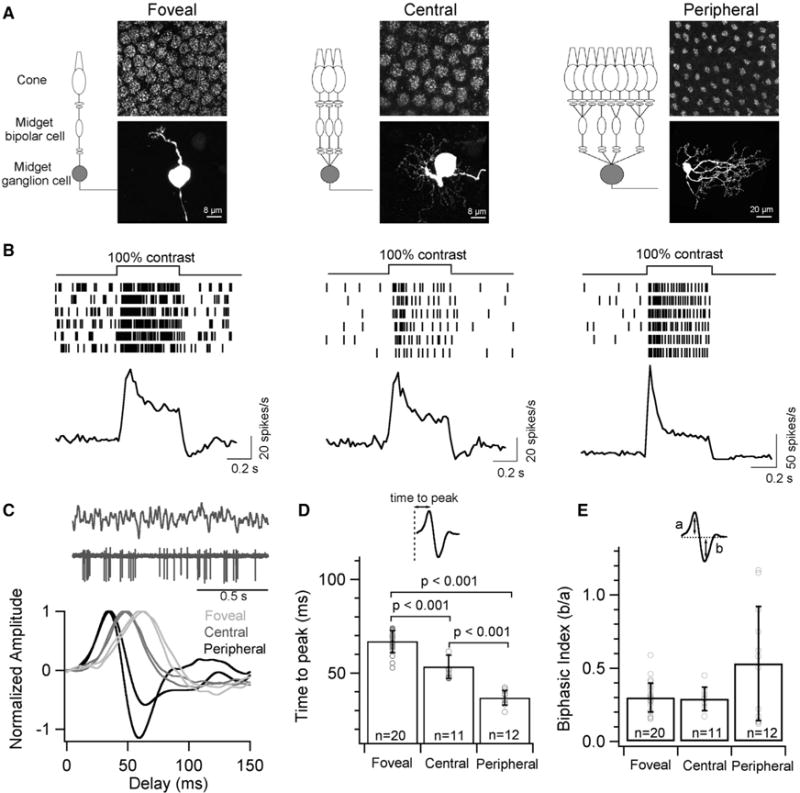
Figure 1. Midget Ganglion Cells Show Slower Response Kinetics in the Fovea than in the Periphery.

(A) Schematic depicting the convergence of the midget circuit in primate retina at three different eccentricities. MGCs were classified as foveal (<1 mm), central (2–4 mm), and peripheral (>6 mm) based on their distance from the foveal pit. Top panel shows a composite fluorescence micrograph of AMPA receptor subunit, GluA3, at the outer plexiform layer indicating the cone density and the bottom panel is the corresponding image of a neurobiotin-filled MGC at each eccentricity.
(B) Spike trains from six trials of an exemplar MGC and the average peri-stimulus time histogram (binwidth of 20ms) across several MGCs at each retinal eccentricity in response to a full-field 100% contrast light step. Note the transient spike response from peripheral MGCs.
(C) Temporal receptive field probed with a full-field Gaussian white noise stimuli. A short excerpt of the stimulus and spike response (top) with exemplar time-reversed spike-triggered average (STA) of individual MGCs at each retinal eccentricity (bottom).
(D) Quantification of the time to peak i.e., latency of the peaks in STAs yields a mean of 67 ± 6 ms for foveal MGCs, 53 ± 6 ms for central MGCs and 37 ± 4 ms for peripheral MGCs. The latency of the STAs is significantly longer for foveal MGCs than central or peripheral MGCs.
(E) Quantification of the biphasic index of STAs i.e., the ratio of the peak amplitudes from the baseline yields a mean value of 0.33 ± 0.15, 0.30 ± 0.06 and 0.51 ± 0.35 for MGCs in foveal, central and peripheral retina, respectively. In all figures, error bars indicate s.d. and ‘n’ refers to the number of cells analyzed.
