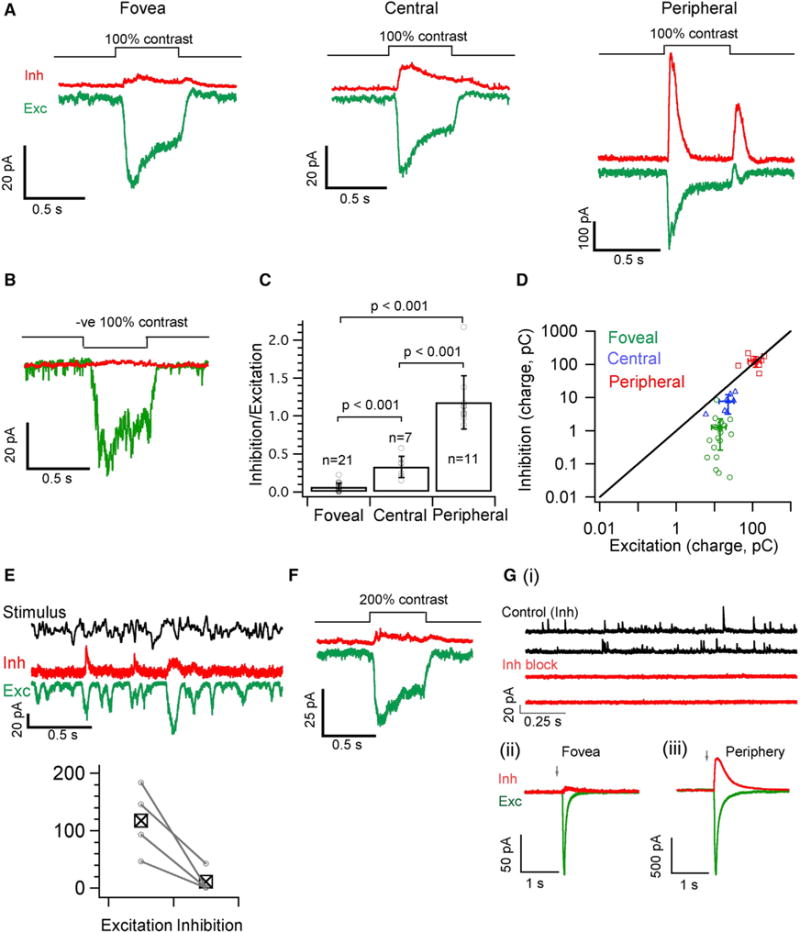
Figure 2. Foveal Midget Ganglion Cells Receive Little or No Light-Evoked Inhibition.

(A) Average excitatory (Exc, in green) and inhibitory (Inh, in red) synaptic currents produced by a 100% contrast light step (background light intensity of 4,000 R*/cone/sec) from voltage-clamped MGCs in foveal, central and peripheral retina.
(B) Mean excitatory (green) and inhibitory (red) synaptic current in response to a negative 100% contrast step measured from a voltage-clamped foveal OFF MGC.
(C) Ratio of the inhibitory to excitatory charge transfer analyzed from individual MGC response to a contrast light step as shown in A for each of the retinal locations. The mean I/E ratio is 0.06 ± 0.05, 0.33 ± 0.14 and 1.18 ± 0.35 for foveal, central and peripheral MGCs respectively.
(D) 2D plot of absolute excitatory versus inhibitory charge transfer across eccentricity (raw values used to calculate I/E ratio in Figure 2C). The average value for peripheral MGCs lies on the unity line whereas foveal and central MGCs are below the unity line and skewed toward excitation.
(E) Exemplar average trace of inhibitory and excitatory synaptic currents of foveal ON MGCs in response to a time varying stimulus. Bottom panel shows a pairwise comparison of stimulus-driven variance in excitatory and inhibitory responses across 4 foveal ON MGCs.
(F) Mean excitatory (green) and inhibitory (red) synaptic current in response to a positive 200% contrast step measured from voltage-clamped foveal ON MGCs (n = 5).
(G) (i), Spontaneous inhibitory synaptic currents (Control Inh) are often observed in foveal MGCs and are blocked after bath application of GABA and Glycine receptor blockers (Inh block).
(G) (ii & iii), Simultaneous uncaging of Glutamate and GABA on the dendrites of foveal and Peripheral MGCs. Average traces of currents evoked by Glutamate (green; MNI-Glutamate) and GABA (red; Rubi-GABA) uncaging from foveal and peripheral MGCs (n = 3) voltage clamped at the inhibitory or excitatory reversal potential. Arrow indicates time of uncaging. The ratio of inhibition to excitation (charge transfer) yields a mean value of 0.1 ± 0.07 and 0.84 ± 0.5 for foveal and peripheral MGCs respectively. See also Figure S5.
