
Fig. 2. The 0.02-Hz oscillation is present in local cortical areas and predominates in somatosensory cortex.
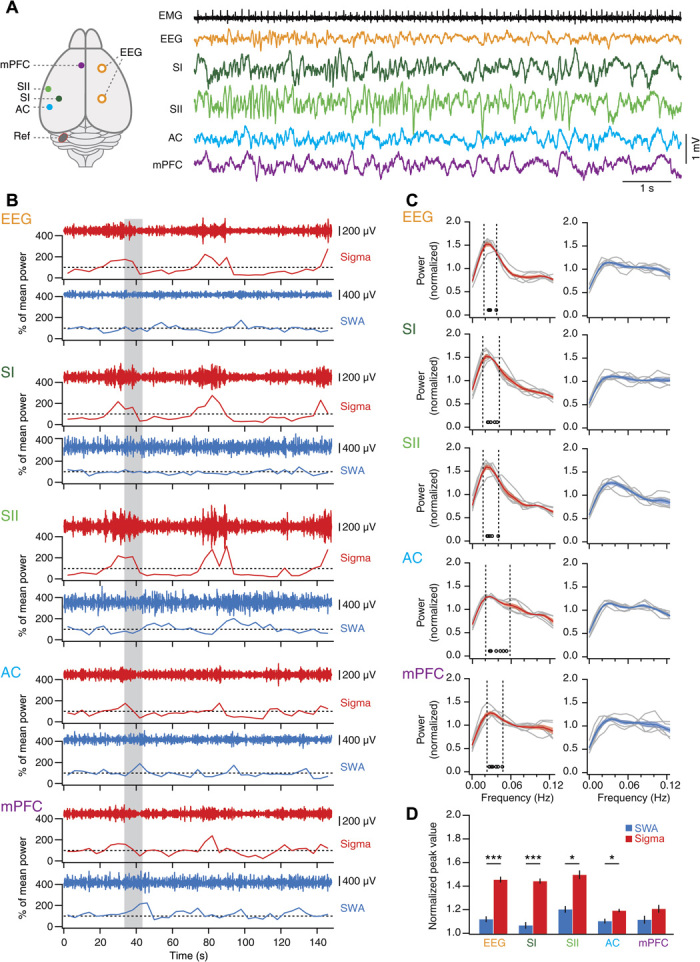
(A) Top view of mouse brain with indication of recording sites and with corresponding representative traces obtained during non-REM sleep scored on the basis of EEG/EMG recordings. (B) Sigma (red) and SWA (blue) power time course for a single non-REM sleep bout recorded simultaneously from all areas. The gray-shaded area indicates the time corresponding to the traces in (A). Dotted lines indicate 100%. (C) FFT of power time course for sigma (left) and SWA (right) for individual mice (gray traces, n = 6) and for the average across mice (color + shading, means ± SEM). Open circles denote FFT peaks obtained from Gaussian fits. Vertical dotted lines indicate mean peak frequency ± 0.5 SD. (D) Mean peak values from (C) for sigma power and SWA for all brain areas and EEG recordings, analyzed as in Fig. 1D. RM ANOVA with factors “area” and “frequency”; area, P = 1.25 × 10⁻⁶; frequency, P = 6.88 × 10⁻⁵; post hoc paired t tests; EEG, t = 11.19, P = 9.93 × 10⁻⁵; SI, t = 17.88, P = 1.01 × 10⁻⁵; SII, t = 5.72, P = 0.0023; AC, t = 2.83, P = 0.037; mPFC, t = 2.02, P = 0.1; *P < 0.01, ***P < 0.001. SI and SII, primary and secondary somatosensory cortex; AC, auditory cortex; mPFC, medial prefrontal cortex; Ref, reference.