
Fig. 3. Regional cortical topology of the 0.02-Hz oscillation in humans.
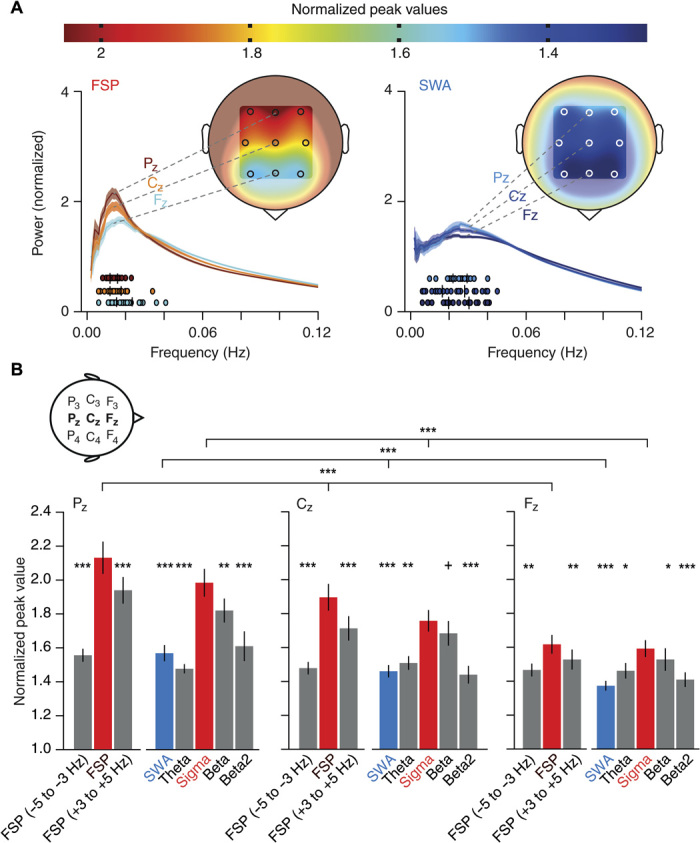
(A) Top: Color scale that indicates the mean normalized power values calculated from the average 0.02-Hz oscillation band (±0.5 SD around average peak values) during non-REM sleep. Bottom: The power spectral profiles for the FSP band (FSP ± 1 Hz, ~13 Hz, left) and the SWA band (right) averaged across subjects (color + shading, means ± SEM) displayed for representative midline electrodes (FZ, CZ, and PZ); analysis as in Fig. 1G. Coloring for power spectral profiles and each subject’s 0.02-Hz oscillation peak (filled circles underneath the power spectral profiles) corresponds to normalized peak values in the color scale. Insets show human head with an approximate topography of the mean normalized peak power values for all nine EEG electrodes (F3, FZ, F4, C3, CZ, C4, P3, PZ, and P4). (B) Mean (±SEM) normalized peak values for FSP band and adjacent frequency bands (FSP −5 to −3 Hz and FSP +3 to +5 Hz), as well as sigma power (10 to 15 Hz), SWA (0.5 to 4 Hz), theta (4 to 8 Hz), beta (16 to 20 Hz), and beta2 (20 to 24 Hz) bands separate for the three midline electrodes (FZ, CZ, and PZ); analysis as in Fig. 1H with data from the participants of the memory study (n = 24). Additional Friedman rank sum test between three midline electrodes for FSP band (P = 3.5 × 10⁻⁸), sigma (P = 6.35 × 10⁻⁹), and SWA (P = 2.8 × 10⁻⁶) (top three horizontal lines), with post hoc–paired comparisons along decreases from Pz to Cz as well as Cz to Fz separate for those three frequency bands (Wilcoxon signed-rank test, all Ps < 0.0036). For consistency with the core study analyses, which relied on nonparametric statistics, the same statistical tests were performed here. +P < 0.1, *P < 0.05, **P < 0.01, ***P < 0.001 for Wilcoxon signed-rank test relative to FSP band (left bar groups) and relative to the sigma band (right bar groups).