
Fig. 4. The 0.02-Hz oscillation imposes periods of high and low fragility to acoustic noise.
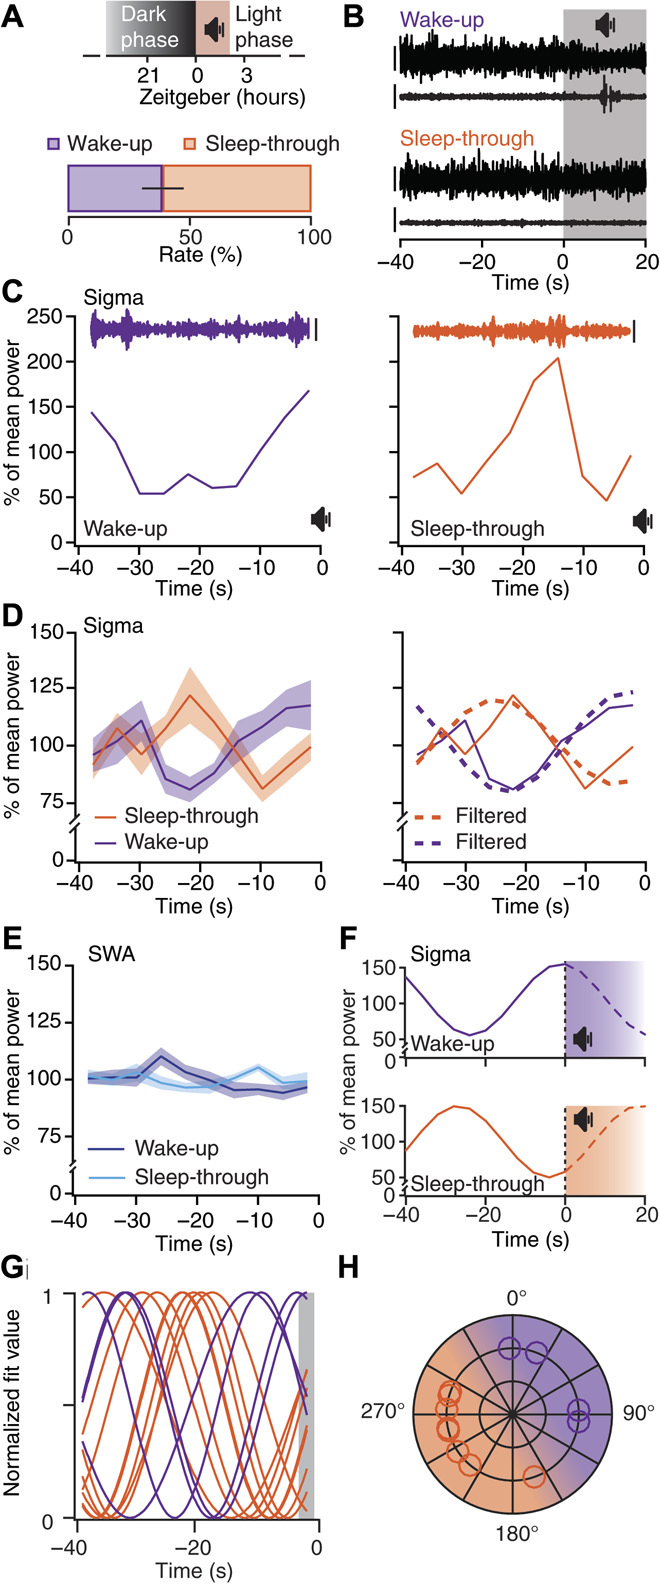
(A) Top: Acoustic stimulation protocol. Bottom: Percentage (means ± SEM) of wake-up and sleep-through trials (n = 10 mice). (B) Representative EEG (ECoG) (upper trace)/EMG (lower trace) traces from wake-up and sleep-through trials. Gray-shaded area indicates period of noise exposure. Scale bars, 400 and 80 μV for EEG(ECoG)/EMG. (C) Time course of sigma power for the 40 s of non-REM sleep before noise onset for a wake-up (violet) and a sleep-through (orange) trial [same data as (B)]. Insets show corresponding band-pass–filtered (10 to 15 Hz) EEG (ECoG) traces. Scale bars, 200 μV. (D) Left: Means ± SEM sigma power time course for wake-up and sleep-through trials (n = 9 and 10, respectively; RM ANOVA for factors “time” and “behavioral outcome”, Greenhouse-Geisser–corrected, P < 0.0042). Right: Overlay of the traces from the left, once unfiltered (continuous line) and once band-pass–filtered (dotted lines) for the frequencies corresponding to 0.02-Hz oscillation peak ± 1 width (see Fig. 1C). (E) Means ± SEM SWA time course as in (D) [same statistics as in (D), P = 0.11]. (F) Projected time course of sigma power during noise exposure for wake-up and sleep-through trials. (G) Waveforms for average wake-up (n = 4) and sleep-through (n = 8) trials obtained through sinusoidal fits. (H) Polar representation of sigma power phases decoded from (G) (shaded area; 0°, peak), with shading of corresponding intervals for high (purple) and low (orange) responsiveness to stimulation.