
Fig. 6. The 0.02-Hz oscillation aligns with heart rate changes in both mice and humans.
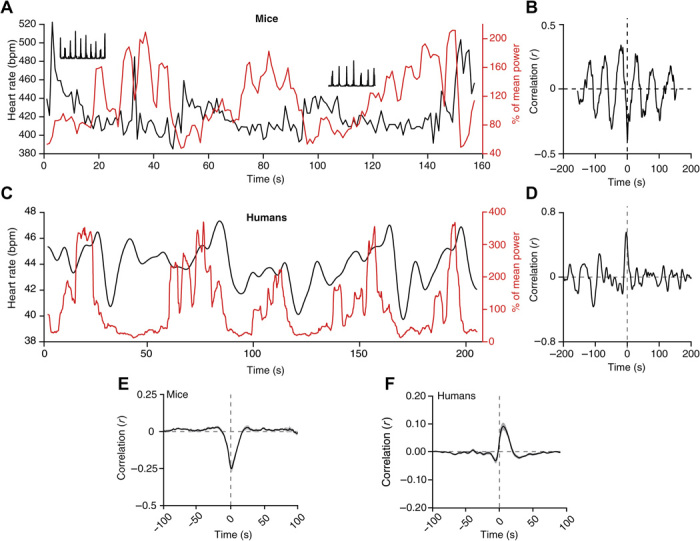
(A) Representative non-REM sleep bout with simultaneous recording of sigma power (red trace) and heart rate [black trace; in beats per minute (bpm)]. Insets show 1-s period of corresponding raw data (squared) to illustrate R-wave detection in EMG traces. (B) Cross-correlogram between sigma power and heart rate for traces in (A). (C) Same as (A) for a single human subject. (D) Corresponding cross-correlogram as (B). (E to F) Mean cross-correlogram for mice (n = 12) (E) and humans (n = 27) (F). Shadowing represents means ± SEM.