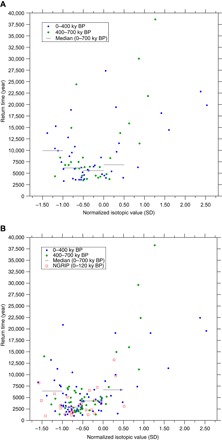
Fig. 3. Frequency of AIM and its relationship with Antarctic temperature.

Return time of AIM plotted against the composite Antarctic isotope record filtered on orbital time scales (Fig. 1F) for 0 to 400 ky (blue circles) and 400 to 700 ky (green diamonds). Median values of return time are plotted as horizontal bars. (A) From AIMs detected in 3-ky low-pass filtered isotopic composite with constant thresholds for the first and second derivatives, with validation by dust records. (B) From AIMs detected using Dome C dust record and validation by unsmoothed isotopic records through visual inspection. Return time for abrupt warming in Greenland (on DFO-2006 time scale) is also plotted (red squares). In each panel, the value of zero on horizontal axis indicates the mean of isotopic composite curve, corresponding to −57.13‰ for Dome Fuji δ18O and −421.3‰ for Dome C δD records.
