. 2017 Jan 28;6:e21589. doi: 10.7554/eLife.21589

Figure 1. Contrast adaptation in awake and anesthetized mice.

(a) Schematic of the experimental setup. Calcium imaging with GCaMP6m (Chen et al., 2013) was performed during the presentation of drifting sinusoidal gratings. (b) Calcium transients from four example putative excitatory cells tuned to a moving sinusoidal grating at 50% contrast (presented for 10 s; grey shadings). The same cells were recorded during wakefulness and anesthesia. (c) Averaged calcium responses of tuned putative excitatory cells. Note that even small differences in adaptation can be detected using two-photon imaging (Figure 1—figure supplement 2a–d). Curves plotted as mean ± SEM (shading). (d) Slope of adaptation of single cells recorded in different behavioral states (same data as in c; line fit to the data in time window 1–9.75 s). Anesthetized mice show a significantly more negative slope compared to all other states [anest. (169 cells) – awake (169 cells): p<10−10; Wilcoxon signed-rank; running (51 cells): p<10−4; resting (169 cells): p<10−10; eye movements (168 cells): p<10−10; eye movement-free (165 cells): p<10−10; Wilcoxon rank-sum]. There was no significant difference between running and resting mice, as opposed to the significant but small difference in eye movement and eye movement-free trials (p=0.49 and p=0.0047, respectively; Wilcoxon rank-sum). NS, not significant; **p<0.005; ***p<0.0005.

DOI: http://dx.doi.org/10.7554/eLife.21589.002

Figure 1.

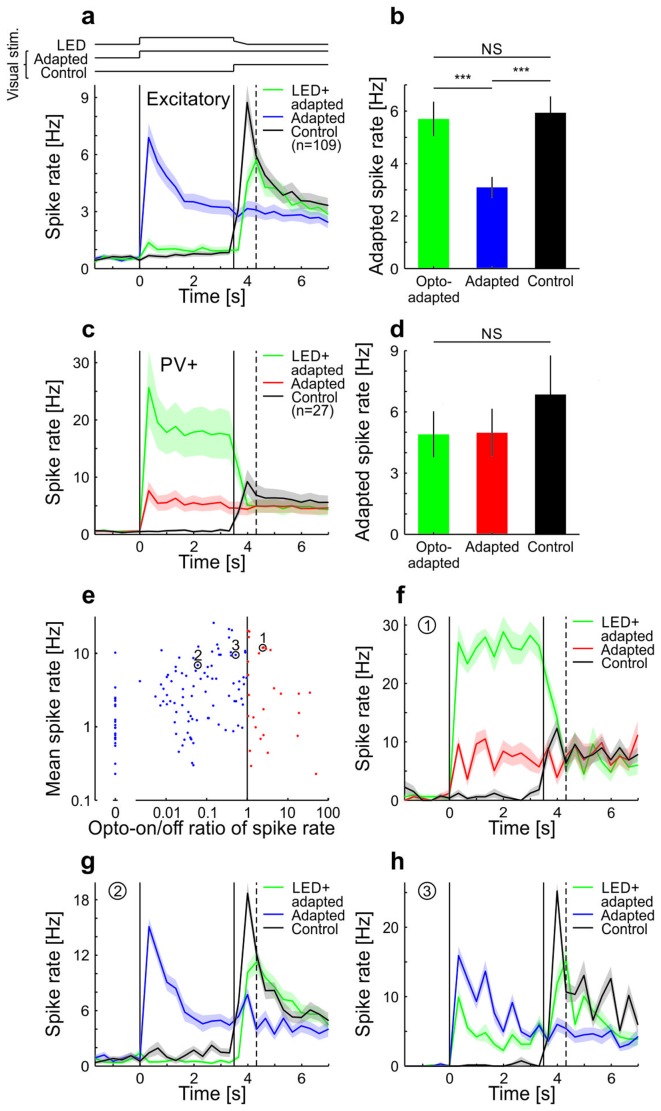
Figure 1—figure supplement 1. Adaptation in visual cortex of anesthetized mice is prevented by optogenetic silencing of cortical neurons (see also King et al. 2016).

Figure 1—figure supplement 1.

Neural activity was recorded with multi-tetrode arrays in anesthetized mice that express channelrhodopsin-2 (ChR2) in parvalbumin-positive (PV+) neurons. To test whether adaptation in V1 depends on local cortical activity, we presented a sustained moving grating with or without locally silencing the visual cortex and probed the V1 activity level immediately after the manipulation time window. (a) Averaged and binned (bin size 333 ms) spike responses of tuned putative excitatory cells to a moving square-wave grating at 100% contrast in anesthetized mice. The responses for three stimulus conditions are shown: Adapted, grating presented for 7 s; Control, grey screen presented for 3.5 s followed by 3.5 s of grating; LED+adapted, grating presented for 7 s with simultaneous optogenetic activation of PV+ cells during the first 3.5 s followed by a 0.5 s decrease of the optogenetic activation of PV+ cells (see Materials and methods). LED (optogenetic activation) and visual stimulus timings are illustrated by the top traces and marked by the vertical solid lines. The vertical dotted line indicates the time bin (first bin after LED off) used to compare the state of adaptation of the three stimulus conditions in b. Average traces are plotted as mean ± SEM (shading). (b) Averaged spike rate for the three stimulus conditions for the bin indicated by the vertical dashed line in a. The LED+adapted condition evokes similar spike rates compared to the control and significantly more than the adapted condition (tuned putative excitatory: 109 cells; LED+adapted/adapted: p<10−10; LED+adapted/control: p=0.13; adapted/control: p<10−10; Wilcoxon signed-rank). Bars plotted as mean ± SEM. (c) Same as a but for PV+ cells. (d) Same as b but for PV+ neurons. All conditions evoke similar spike rates (tuned PV+: 27 cells; LED+adapted/adapted: p=0.73; LED+adapted/control: p=0.067; adapted/control: p=0.17; Wilcoxon signed-rank). (e) Scatterplot of the average spike rate responses of all cells during the first 3.5 s of their preferred grating stimulus, with and without optogenetic stimulation of PV+ cells. Cells that increased their firing during the optogenetic stimulation of PV+ cells were classified as PV+ neurons, the remaining ones as putative excitatory cells. Highlighted cells (1–3) are shown in f–h. (f) Same as a but for a single cell classified as PV+. (g,h) Same as f but for two example cells classified as putative excitatory. NS, not significant; ***p<0.0005.

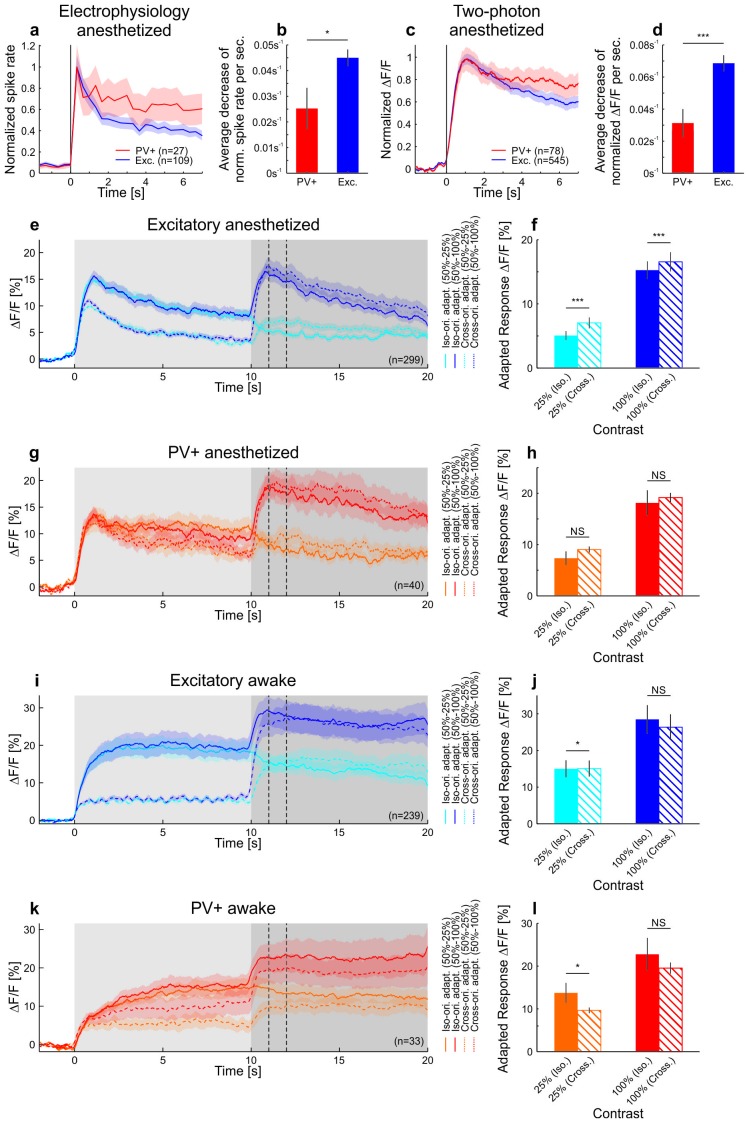
Figure 1—figure supplement 2. Differences in contrast adaptation across cell-types can be revealed using two-photon imaging.

Figure 1—figure supplement 2.

Under anesthesia, PV+ neurons adapted less than putative excitatory cells, consistent with the idea that they might inhibit other neurons to produce contrast adaptation (Keller and Martin, 2015). Moreover, iso- and cross-orientation adaptation had similar effects on the population (see also Stroud et al., 2012). In mouse V1, PV+ neurons are much less selective to a grating of different orientations than excitatory neurons (Atallah et al., 2012; Hofer et al., 2011; Kerlin et al., 2010). Therefore, an adaptation mechanism based on PV+ neurons would result in adaptation that is only weakly dependent on the orientation of the stimulus. Indeed, adapting putative excitatory cells to their preferred or null (orthogonal to preferred) orientation results in a significant, but small difference in adapted firing rates. Moreover, no difference was found when adapting PV+ cells with either iso- or cross-orientation under anesthesia (with respect to test orientation). (a) Neural activity was recorded with multi-tetrode arrays in anesthetized mice (same cells as in Figure 1—figure supplement 1a,b). Averaged and normalized responses of tuned putative excitatory and PV+ cells to a moving square-wave grating at 100% contrast presented for 7 s in anesthetized mice. Curves plotted as mean ± SEM (shading). (b) Adaptation is quantified as the mean decrease in the normalized spike rate per second during the stimulus presentation (tuned putative excitatory: 109 cells; PV+: 27 cells; p=0.010; Wilcoxon rank-sum). Bars plotted as mean ± SEM. (c) The neural activity of tuned putative excitatory compared to PV+ cells recorded with two-photon calcium imaging. Averaged and normalized calcium responses to a moving sinusoidal grating at 50% contrast presented for 7 s in anesthetized mice. Curves plotted as mean ± SEM (shading). (d) Adaptation is quantified as the mean decrease in normalized ∆F/F per second during the stimulus presentation (tuned putative excitatory: 545 cells; PV+: 78 cells; p=3.7×10⁻⁴; Wilcoxon rank-sum). The initial rise was excluded in the estimation of the slope (see Materials and methods). (e) Averaged responses of tuned putative excitatory cells in anesthetized mice to a moving sinusoidal grating at 50% contrast presented for 10 s followed by 10 s of a second stimulus of increased (100% contrast; dark traces) or decreased contrast (25% contrast; light traces). The first stimulus was either presented at the optimal (solid traces) or the orthogonal orientation of the neurons (dotted traces). The second stimulus was always presented at the optimal orientation. The two vertical dotted lines indicate the time window which was used to compare iso- and cross-orientation adaptation in f. ∆F/F traces plotted as mean ± SEM (shading). (f) Iso-orientation compared to cross-orientation adaptation (50% contrast) of tuned putative excitatory cells measured at 25% or 100% contrast. This is quantified as average ∆F/F after adaptation (seconds 11–12; indicated by the vertical dotted lines in e; 299 cells; 25%: p<10−10; 100%: p<10−4; Wilcoxon signed-rank). (g) Same as e but for PV+ cells. (h) Same as f but for PV+ cells (40 cells; 25%: p=0.12; 100%: p=0.98; Wilcoxon signed-rank). (i) Same as e but in awake mice. Note that the absence of adaptation to the moving sinusoidal grating at 50% contrast (0–10 s) cannot be explained by a response ceiling since the cells increase their responses when increasing the contrast to 100% (at 10 s). (j) Same as f but in awake mice (239 cells; 25%: p=0.0082; 100%: p=0.14; Wilcoxon signed-rank). (k) Same as i but for PV+ cells. (l) Same as j but for PV+ cells (33 cells; 25%: p=0.0064; 100%: p=0.20; Wilcoxon signed-rank). Bars plotted as mean ± SEM. NS, not significant; *p<0.05; ***p<0.0005.

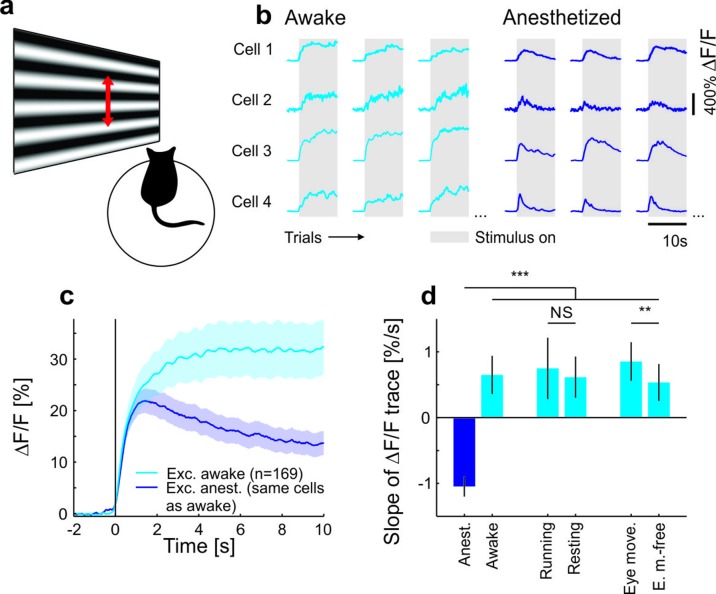
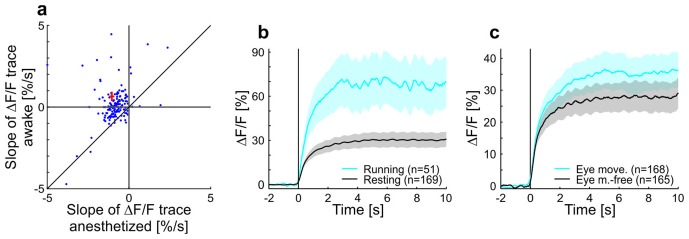
Figure 1—figure supplement 3. Contrast adaptation in anesthetized compared to awake mice and effects of running and eye movements on adaptation in awake mice.

Figure 1—figure supplement 3.

(a) Scatterplot showing slopes of adaptation of tuned putative excitatory cells recorded in anesthetized and awake mice (same cells as in Figure 1c,d; line fit to the data in time window 1–9.75 s). Seventeen cells not visible in the plot as they lie outside of the axis shown - 13 above and 4 below the diagonal. Red cross shows mean ± SEM. (b) Averaged responses of tuned putative excitatory cells to a moving sinusoidal grating at 50% contrast presented for 10 s in awake running and resting mice. See also Figure 1d. Note that the number of cells for running (51 cells) is smaller than for the resting condition (169 cells) because not all cells were recorded in both conditions. Curves plotted as mean ± SEM (shading). (c) Same as b but for trials with eye movements and eye movement-free trials.

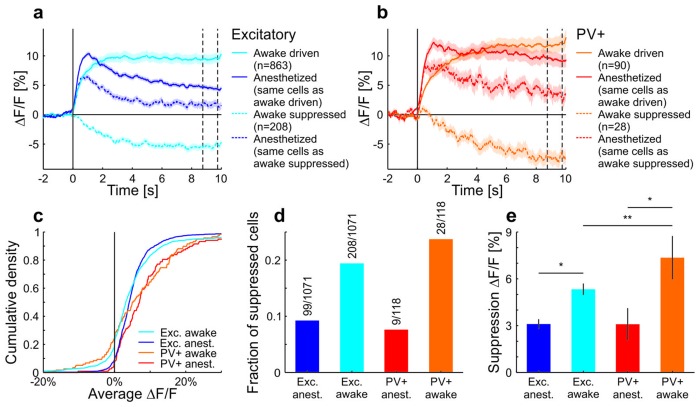
Figure 1—figure supplement 4. A large fraction of neurons in awake mice were suppressed during the stimulus and decreased their activity below baseline.

Figure 1—figure supplement 4.

The group of cells that were suppressed showed a positive average response under anesthesia. Of the putative excitatory cells, fewer cells showed a decrease compared to PV+ cells. Moreover, the magnitude of the decrease was larger for PV+ cells compared to putative excitatory cells. (a) All putative excitatory cells recorded in awake mice divided into groups which increase or decrease their activity in response to a moving sinusoidal grating at 50% contrast. The responses of the same groups of neurons are shown for the anesthetized mice. Note that the cells that are suppressed by the grating stimulation in awake mice are excited in anesthetized mice. The two vertical dotted lines indicate the time window which was used to compare the decrease in activity in c. Curves plotted as mean ± SEM (shading). (b) Same as a but for PV+ cells. (c) Cumulative density of cells based on their average activity in response to the grating. (d) Fraction of putative excitatory and PV+ cells in awake and anesthetized mice with a negative average ∆F/F (compared to baseline) in response to the grating. (e) The average decrease from baseline (of decreasing cells) in response to the grating (average of 8.75–9.75 s as indicated by the vertical dotted lines in a,b). Decreases are significantly larger in awake mice compared to anesthetized mice (putative excitatory awake: 208 cells; putative excitatory anesthetized: 99 cells; p=0.011; PV+ awake: 28 cells; PV+ anesthetized: 9 cells; p=0.010; Wilcoxon rank-sum). In awake mice, the decrease is significantly larger in PV+ compared to putative excitatory cells (putative excitatory: 208 cells; PV+: 28 cells; p=0.0038; Wilcoxon rank-sum). *p<0.05; **p<0.005.