. 2017 Jan 28;6:e21589. doi: 10.7554/eLife.21589

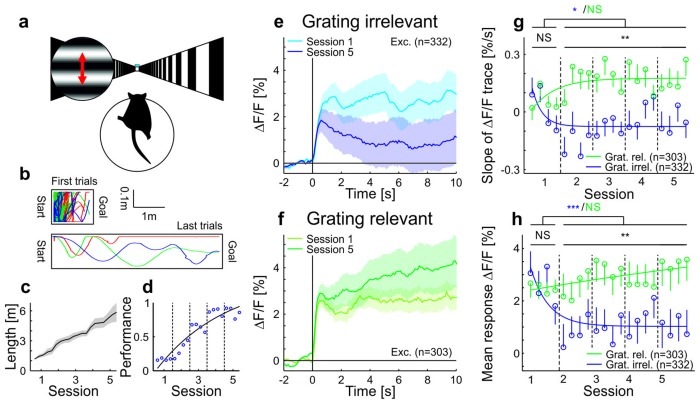
Figure 2. Adaptation is modulated by stimulus relevance in awake mice.

(a) Schematic of the behavioral task. For the grating-irrelevant condition, movement of a virtual tunnel projected on a toroidal screen was coupled to the locomotion (rotation and running on a spherical treadmill) of the head-restrained mice (Dombeck et al., 2007). Mice were trained to orient and run to the end of the tunnel for a water reward. We presented a horizontal sinusoidal moving grating in a circular probe patch centered on the retinotopic location of the recording site, interspersed with random intervals of gray (10–20 s; Video 1). (b) First and last paths of a sample mouse (four days apart). The colors show individual trials. (c) Task difficulty (length of the tunnel) was increased over learning to keep the number of rewards approximately constant. (d) Learning curve of an example mouse (solid line: exponential fit). The performance is quantified as the fraction of time spent running in the direction of the goal (±25°). (e) Data from animals trained in the behavioral task under grating-irrelevant conditions. Traces show averaged calcium responses (GCaMP6f) (Chen et al., 2013) of tuned putative excitatory cells to a moving sinusoidal grating. Curves plotted as mean ± SEM (shading). (f) Same as e but for animals exposed to the grating-relevant condition. For this condition, the visual stimulus on the screen was a replay of the visual flow from one of the mice in the grating-irrelevant group. To match the initial responses of the grating-relevant and the grating-irrelevant traces, ten percent of neurons were excluded from analysis (see Materials and methods). Note that this did not change the results. (g) Slopes of adaptation of the same cells as in e and f (line fit to the data in time window 1–10 s). In the grating-irrelevant condition, the slope significantly decreases from the first to the following sessions, as opposed to the grating-relevant condition (putative excitatory: 332 and 303 cells, respectively; p=0.017 and p=0.28, respectively; Wilcoxon signed-rank). The slopes for the two conditions are similar during the first session, but significantly differ during later sessions (putative excitatory: 332 and 303 cells; p=0.84 and p=0.0036, respectively; Wilcoxon rank-sum). The solid curves are exponential fits to the data. Error bars represent mean ± SEM. (h) Same as g but for mean response to the grating. In the grating-irrelevant condition, the mean response significantly decreases from the first to the following sessions, as opposed to the grating-relevant condition (putative excitatory: 332 and 303 cells, respectively; p<10−4 and p=0.85, respectively; Wilcoxon signed-rank). The mean responses for the two conditions are similar during the first session, but significantly differ during later sessions (putative excitatory: 332 and 303 cells; p=0.61 and p=0.0015, respectively; Wilcoxon rank-sum). NS, not significant; *p<0.05; **p<0.005; ***p<0.0005.

DOI: http://dx.doi.org/10.7554/eLife.21589.007

Figure 2.

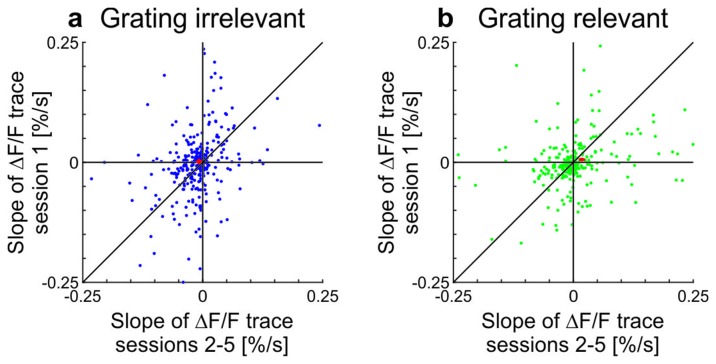
Figure 2—figure supplement 1. Scatterplots showing slopes of adaptation of the cells in training session one compared to the average slope in sessions 2–5 in awake mice (see also Figure 2; line fit to the data in time window 1–10 s).

Figure 2—figure supplement 1.

(a) Grating-irrelevant condition (same cells as in Figure 2e,g; 28 cells not visible in the plot as they lie outside of the axis shown, 16 above and 12 below the diagonal). Red cross shows mean ± SEM. (b) Grating-relevant condition (same cells as in Figure 2f,g; 12 cells not visible in the plot as they lie outside of the axis shown, 3 above and 9 below the diagonal). Red cross shows mean ± SEM.

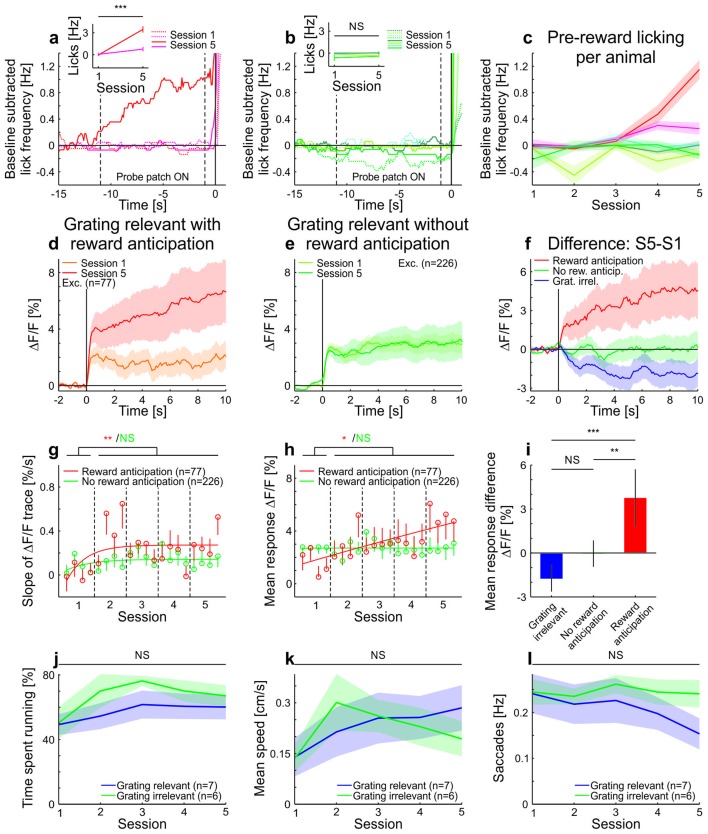
Figure 2—figure supplement 2. Licking, running, and eye-movement behavior in awake mice.

Figure 2—figure supplement 2.

(a–c) Lick frequency for grating-relevant condition. (a) Baseline subtracted lick frequency of the two animals showing a significant increase in anticipatory licking from session 1 (dotted colored lines) to session 5 (solid colored lines). The two vertical dotted lines indicate the stimulus presentation and the vertical solid line at 0 s indicates the water reward. Inset: Average anticipatory lick frequency (−0.5–0 s) is significantly higher in session five compared to session one in these two animals (session 1: 111 trials, session 5: 144 trials, p<10−4 and session 1: 146 trials, session 5: 143 trials, p<10−10; Wilcoxon rank-sum). (b) Same as a, but for the animals with no significant increase in anticipatory licking (session 1: 145 trials, session 5: 144 trials, p=0.093; session 1: 108 trials, session 5: 131 trials, p=0.083; session 1: 108 trials, session 5: 135 trials, p=0.20 and session 1: 144 trials, session 5: 135 trials, p=0.49; Wilcoxon rank-sum). (c) Average pre-reward lick frequency (−0.5–0s) for all animals over all sessions. (d) Averaged responses of tuned excitatory cells of the same animals as in a, to a moving sinusoidal grating (displayed in the probe patch) for sessions 1 and 5. Ten percent of the neurons were excluded to match the initial conditions of the grating-relevant traces to the grating-irrelevant traces (see Materials and methods for details). Note that this did not change the results. Curves plotted as mean ± SEM (shading). (e) Averaged responses of tuned excitatory cells of the same animals as in b, to a moving sinusoidal grating (displayed in the probe patch) for sessions 1 and 5. Ten percent of the neurons were excluded to match the initial conditions of the grating-relevant traces to the grating-irrelevant traces (see Materials and methods for details). Note that this did not change the results. Curves plotted as mean ± SEM (shading). (f) Traces show the differences in averaged responses of tuned excitatory cells between session 1 and 5 for the three conditions: grating-irrelevant; grating-relevant without anticipatory licking; and grating-relevant with anticipatory licking. (g) Slopes of adaptation of the same cells as in d and e are shown. For reward anticipating mice, the slope significantly increases from the first to the following sessions (putative excitatory: 77 cells; p=0.0022; Wilcoxon signed-rank). For the non-anticipating mice, the slope did not show any significant difference from the first to the following sessions (putative excitatory: 226 cells; p=0.45; Wilcoxon signed-rank). The trials of each session were divided into four quarters. The vertical dashed lines separate the individual sessions. The solid curve is an exponential fit to the data. Error bars represent mean ± SEM. (h) Same as g but for mean response to the grating. For reward anticipating mice, the mean response significantly increases from the first to the following sessions (putative excitatory: 77 cells; p=0.020; Wilcoxon signed-rank). For the non-anticipating mice, the mean response did not show any significant change from the first to the following sessions (putative excitatory: 226 cells; p=0. 23; Wilcoxon signed-rank). (i) Bar plot shows the mean response difference (session 5 – session 1) for the three traces in f. Reward anticipating mice have a significantly larger response difference compared to mice under grating-relevant condition (77 cells and 332 cells, respectively; p<10−4; Wilcoxon rank-sum) or non-anticipating mice (77 cells and 226 cells, respectively; p=9.0×10⁻⁴; Wilcoxon rank-sum). There is no significant difference between grating-irrelevant and non-anticipating mice (332 cells and 226 cells, respectively; p=0.13; Wilcoxon rank-sum). (j) Proportion of time spent running over sessions for grating-irrelevant and grating-relevant conditions. The time spent running is not significantly different for the grating-irrelevant compared to the grating-relevant condition (7 and 6 mice; session 1: p=0.84; session 2: p=0.18; session 3: p=0.53; session 4: p=0.45; session 5: p=0.23; Wilcoxon rank-sum). Curves plotted as mean ± SEM (shading). (k) Same as j, but for mean speed. The mean speed is not significantly different for the grating-irrelevant compared to the grating-relevant condition (7 and 6 mice; session 1: p=0.84; session 2: p=0.45; session 3: p=0.95; session 4: p=0.84; session 5: p=0.29; Wilcoxon rank-sum). Curves plotted as mean ± SEM (shading). (l) Same as j but for saccade frequency. The saccade frequency is not significantly different for the grating-irrelevant compared to the grating-relevant condition (7 and 6 mice; session 1: p=0.63; session 2: p=0.84; session 3: p=0.53; session 4: p=0.45; session 5: p=0.073; Wilcoxon rank-sum). Curves plotted as mean ± SEM (shading). NS, not significant; *p<0.05; **p<0.005; ***p<0.0005.