Figure 4. Simulation of axon shape with varying mechanical properties.
(A) Representative images derived from simulations based on a discrete elastic rod or DER model (Methods, Appendix) using the following parameters: B = 510−24 N m2, G = 1.35 kPa and the value of for tension as indicated in each panel. In this example, tension decreases from top to bottom: (i) Stiff and twisted neuron remains straight. (ii) A slight decrease in tension causes local bends and spiraling. (iii) Further reduction in tension leads to the transfer of torsional energy into bending of the rod and the formation of local coils. (iv) Further reduction in tension causes the coils in the model neuron to rotate, leading to plectonemes spaced at regular intervals. (B) Parameter space plot of a simulated neuron subjected to low torque (top, shear modulus, G = 0.33 kPa) or higher torque (bottom G = 1.35 kPa) and varying axial stiffness and bending stiffness. For panels (B–D), vertex color shows the number of coils predicted for pair of values for tensile modulus and bending rigidity, according to the scale to the right of each plot. Gray areas indicate conditions with no coils; beige areas indicate conditions with at least one coil; green line indicates the boundary between the two shape phases. (C) Parameter space plot of a simulated neuron under low (top, 1 kPa) and high tension (bottom, 6 kPa) and varying shear modulus and bending stiffness. (D) Parameter space plot of a simulated neuron with low (top, 1.2510−24 Nm2) and high bending stiffness (bottom, 7.510−24 Nm2) and varying shear and elastic moduli. Bending stiffness was calculated according to B=EI, with I as the second moment of inertia. (E) Comparison of the morphology of an TRN in ptl-1(ok621); unc-70(e524) double mutant animals with a simulation result of our DER model with the following parameters: bending stiffness = 7.510−24 Nm2; shear modulus = 8 kPa; axial stiffness = 1 kPa. Scale = 10 µm.

Figure 4—figure supplement 1. Atomic force microscopy on axons of isolated TRNs.

Figure 4—figure supplement 2. Elastic moduli of axons of touch receptor neurons in vitro.

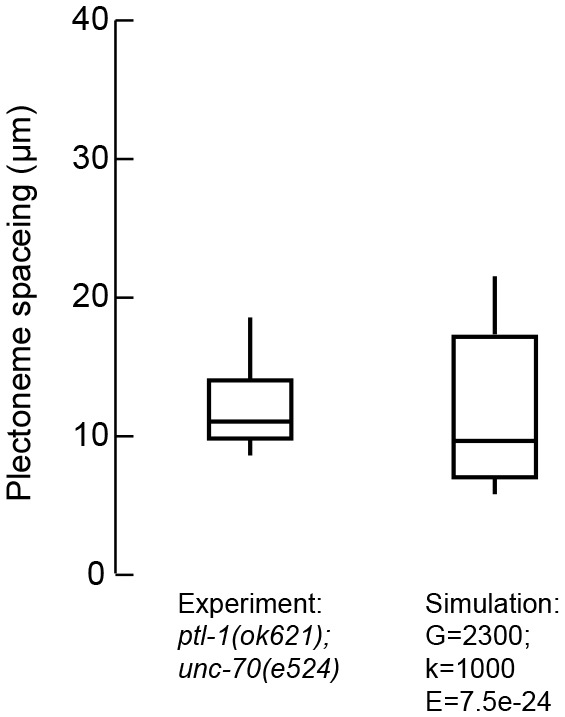
Figure 4—figure supplement 3. The distance between plectonemes in mutant and simulated axons.