
Figure 5.
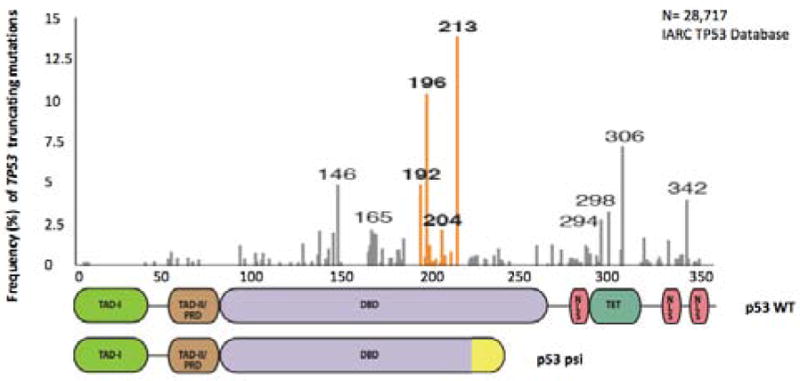
Tumor Distribution of TP53 truncating mutations. A) Histogram depicting the frequency of somatic TP53 truncating mutations in tumors. This plot demonstrates that exon-6/exon-7 truncating mutations are particularly abundant and occur at higher than expected frequencies. Exon-6/exon-7 truncating mutation hot-spots are indicated in orange.