
Figure 6.
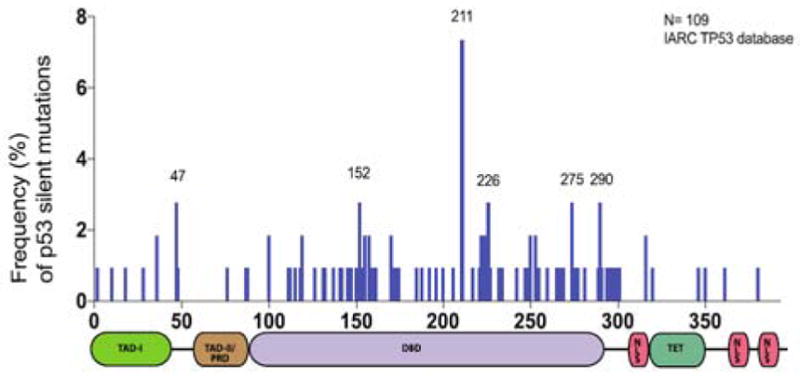
Distribution of TP53 silent mutations. A) Histogram depicting the frequency of somatic TP53 silent mutations in tumors. This plot demonstrates that silent mutations occur at higher than expected frequencies at certain locations on the TP53 gene. Labeled residues are mutation hot-spots.