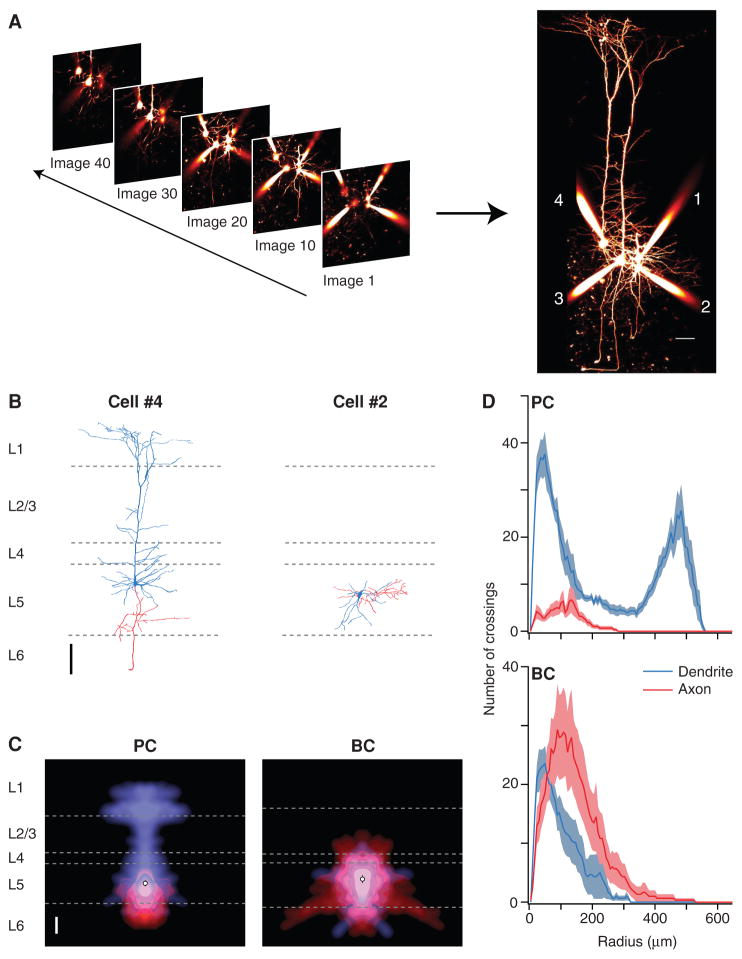
FIGURE 4.
Morphological cell classification from two-photon images. (A) A stack of two-photon slices provides a 3D representation of recorded neurons filled with Alexa 594. Each slice is an average of two to four 512 × 512-pixel frames collected. Maximum-intensity projections are assembled for full morphological view (scale bar: 50 μm). (B) Digital reconstruction of cell 4 (left) shows that this is a neocortical L5 pyramidal cell (PC), whereas the morphology of cell 2 (right) is characteristic of a basket cell (BC; scale bar: 100 μm). Reconstructions were performed using Neuromantic (Blackman et al. 2014). Dendrites (blue) and axons (red) were distinguished by the presence of dendritic spines or axonal boutons. Dashed gray lines represent layer boundaries, as determined from simultaneously acquired laser-scanning Dodt contrast images. (C) Morphology density map (Buchanan et al. 2012) of six PCs (left) highlights the characteristic apical dendrite, with an axonal arborization that remains localized to L5. The corresponding map of six BCs (right) shows axonal and dendritic arbors that both remain confined to L5. Average soma location indicated by open circle (scale bar: 100 μm). (D) Sholl Analysis (Sholl and Uttley 1953) of six PCs (top) and six BCs (bottom) provides quantitative cell classification criteria from axonal and dendritic branching patterns.

