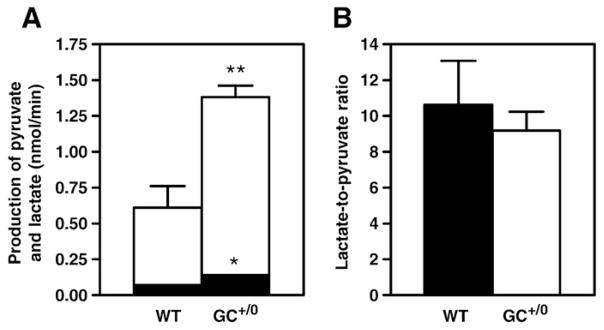
Fig. 2.
Lactate and pyruvate production rate and the lactate-to-pyruvate production ratio assessed in isolated working hearts from control WT and GC+/0 mice. Data are means±SEM of 4 heart perfusion experiments. A. Lactate and pyruvate release rates were calculated from the product of coronary flow rates and concentration differences in the influent and effluent perfusates of [U-13C3]lactate (open bars) and [U-13C3]pyruvate (solid bars) in hearts perfused with [U-13C6]glucose as determined by gas chromatography coupled to mass spectrometry (GCMS) and enzymatic assays. B. Lactate-to-pyruvate ratio, in arbitrary units, is expressed as the release rate of lactate divided by the release rate of pyruvate in WT hearts (solid bars) and GC+/0 hearts (open bars). *P < 0.05 and **P < 0.01 GC+/0 vs WT mouse hearts.

