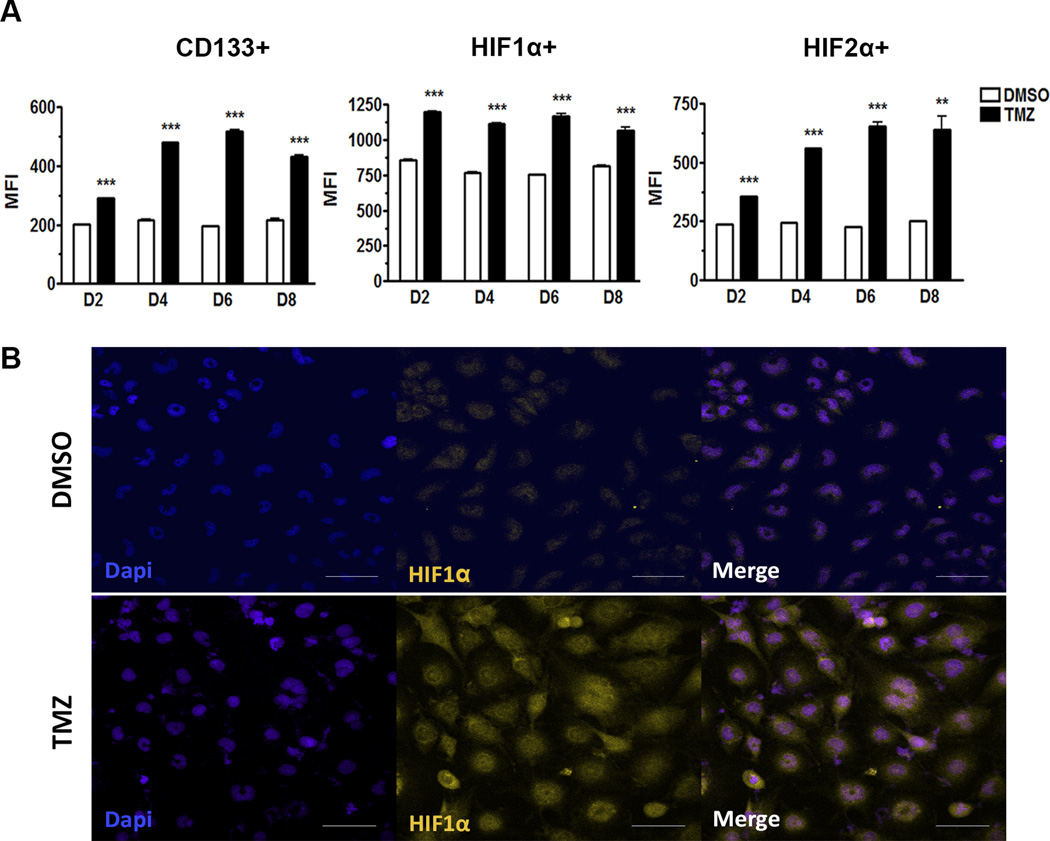
Figure 4. HIF1α and HIF2α are upregulated upon primary chemotherapy in the recurrent model.
A) Flow cytometry analysis of GBM43 cells treated with TMZ (50µM) 2–8 days post-treatment. CD133 shows a peak at day six, HIF1α expression increases at day two and remains at similar levels throughout, and HIF2α also shows a peak at day six, all post-therapy. B) Immunofluorescence analysis of GBM43 line treated with TMZ (50µM) for 48 hours demonstrating induction of HIF1α post therapy. The control group (DMSO) received DMSO. Error bars denote S.E.M. P: **P<0.01, ***P<0.001, one-way analysis of variance.

