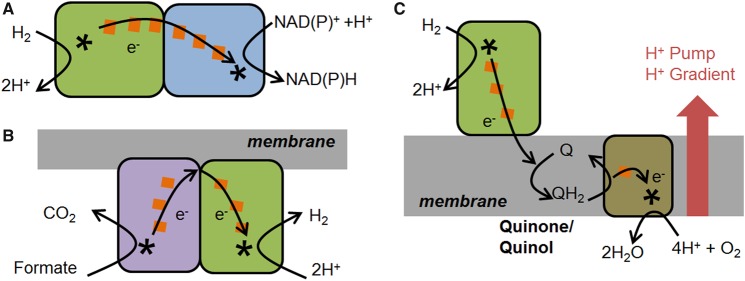
Figure 1. Schematic representation of some of the biological functions of NiFe hydrogenases.
(A) H2 oxidation coupled to NAD(P)H generation by an NAD+-reducing soluble hydrogenase. (B) Formate oxidation coupled to H2 generation by part of the formate hydrogen lyase complex. (C) H2 oxidation by a membrane-bound hydrogenase coupled [via the quinone pool, Q/QH2 (quinone/quinol)] to O2 reduction and proton pumping across the inner membrane. Electron transfer relays are represented by orange squares (the number of squares does not necessarily reflect the number of naturally occurring redox centres), while catalytic sites are represented by asterisks, throughout.

