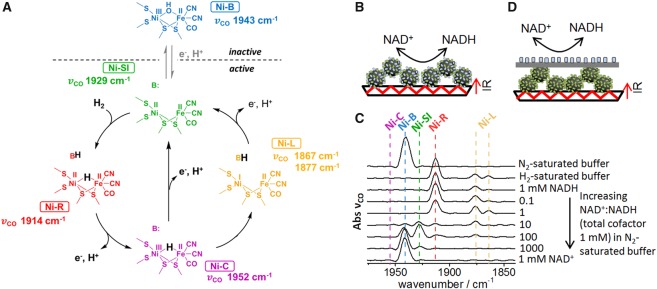
Figure 10. Attenuated ATR IR spectroscopy used to probe the electronic connection between the hydrogenase and NAD+-reducing enzyme moiety on carbon particles.
(A) Main inactive and active states of the catalytic site of E. coli Hyd1, together with the vCO wavenumber positions observed for each state. B: indicates basic site(s) that accept protons during catalysis, which could include co-ordinated cysteine sulphur atoms, and other surrounding amino acid residues. (B) Schematic representation of the experimental set-up for testing particles modified with a mixture of hydrogenase and NAD+-reducing moiety. (C) Set of ATR IR spectra recorded during solution exchange experiments. The cell solution contained 50 mM Tris–HCl (pH 8.0), and the H2/N2 and NAD+/NADH concentrations were varied as indicated on the figure. (D) Schematic representation of the experimental set-up for testing the immobilised enzymes physically separated by a piece of carbon paper (Toray TGP-H-030), in response to changes in solution H2/N2 or NAD+/NADH ratio. For these experiments, the hydrogenase was E. coli Hyd1 [18], and the NAD+-reducing moiety was HoxHI64AYFU of R. eutropha soluble hydrogenase, with the hydrogenase portion inactivated by an I64A exchange in the HoxH subunit (prepared according to established protocols) [46]. Carbon particles were BP2000 carbon black.

