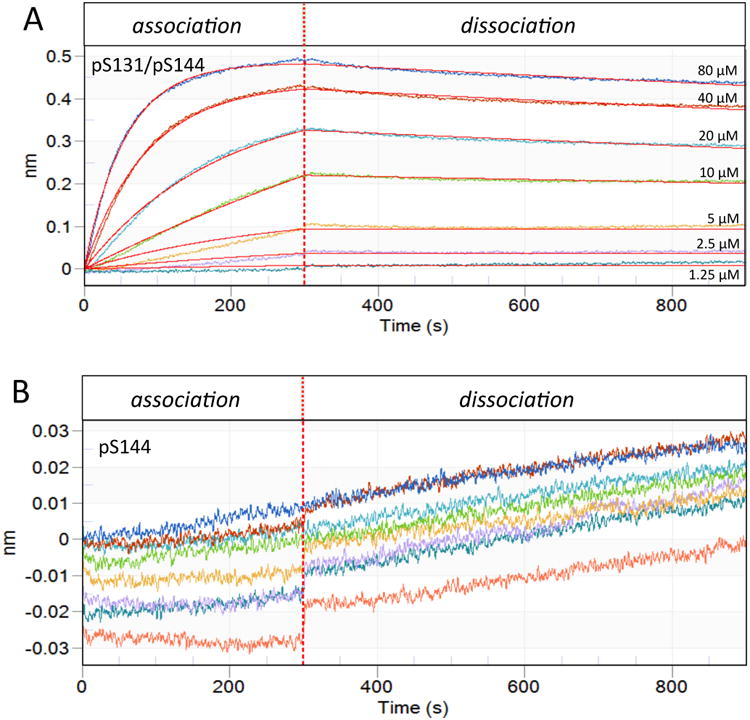
Figure 11. Biolayer Interferometry demonstrates bivalent advantage of IRAK1-Pin1 interaction at low micromolar concentrations.

Pin1 was immobilized on the biosensor tip and dipped into peptide-containing well (association) then buffer only well (dissociation). The X-axis is the residence time in each well and the Y-axis denotes the change in wavelength upon binding. The vertical dotted line represents transfer of the biosensor between the association phase (containing peptide) and the dissociation phase (lacking peptide). A) Association-dissociation curves for p131/p144 peptide concentrations of 80, 40, 20, 10, 5, 2.5 and 1.25 μM (as marked, also color-coded) were fit to a simple bimolecular binding model (red lines). B) Association-dissociation curves for p144 peptide concentrations as in A (with same color-coding), plotted on a vertical scale amplified by an order of magnitude relative to A. Binding was insufficient for curve fitting. Since analysis could not be performed, the control spectrum is also shown (salmon).
