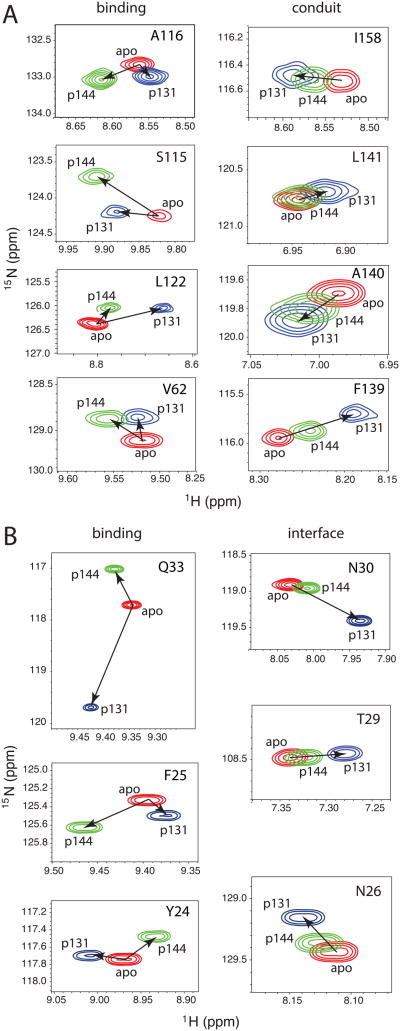
Figure 7. Difference between peak movements attributable to interdomain interactions versus protein-peptide binding induced by titration with p131 and p144.
Regions extracted from 15N-1H HSQC spectra of Pin1-FL in apo (red), the most saturated spectrum from titration with p131 (blue), and the most saturated spectrum from titration with p144 (green). A) PPIase residues in either the binding site or implicated in conduit that informs on allostery[44, 45]. B) WW residues in either the binding site or at the interface between the two domains.

