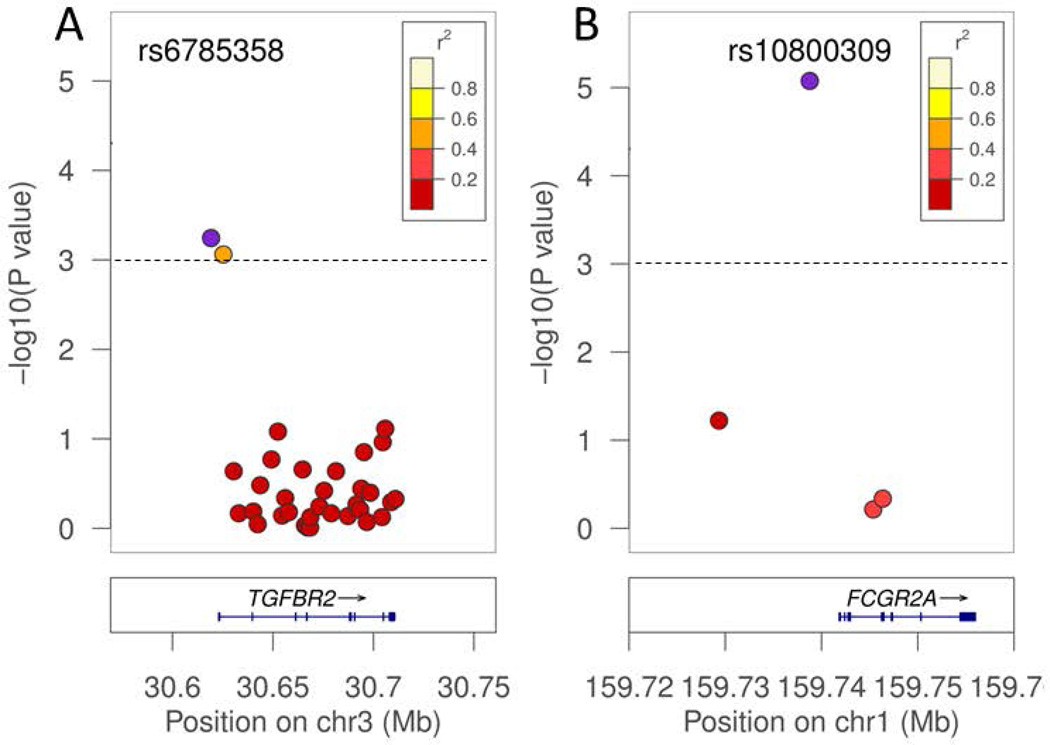
Fig. 1.
Most highly associated SNPs in candidate genes. Associations between VL phenotype and rs6785358 upstream of TGFBR2 (A), and the DTH positive phenotype and the rs10800309 upstream of FCGR2A (B), are plotted along with tagging SNPs covering the candidate gene. The blue points represent the strongest association for the trait within the candidate gene. The LD structure between the most closely associated SNP and other flanking SNPs is indicated by a color gradient on flanking SNPs, with white in strong LD, and red being in weak LD. The dashed line represents the global adjusted Bonferroni threshold of significance at p=0.001 cutoff.

