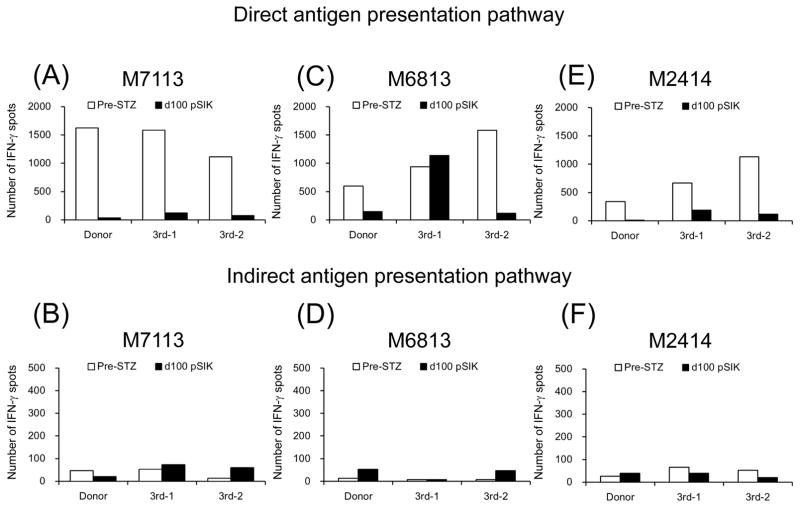
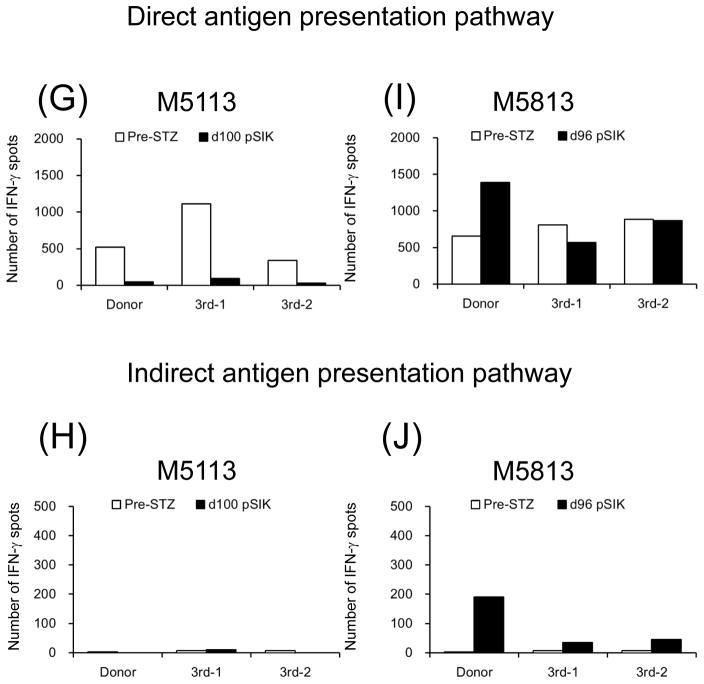
Figure 7. Cellular alloimmune responses to allografts.
The frequencies of directly and indirectly stimulated, donor- or 3rd party-reactive IFN-γ–secreting T cells were evaluated with ELIspot assay. White and black bars represent numbers of IFN-γ spots per 1 million T cells at pre-STZ and d100 post-SIK or rejected, respectively. Except for immunologically rejected animal (M5813) (I and J), all aCD40/Rapa-treated recipients (A, B, E, F, G, H, I, and J) showed hypo-responsiveness against donor antigen stimulations at d100 post-SKT compared with those of Pre-STZ.


