
Figure 1.
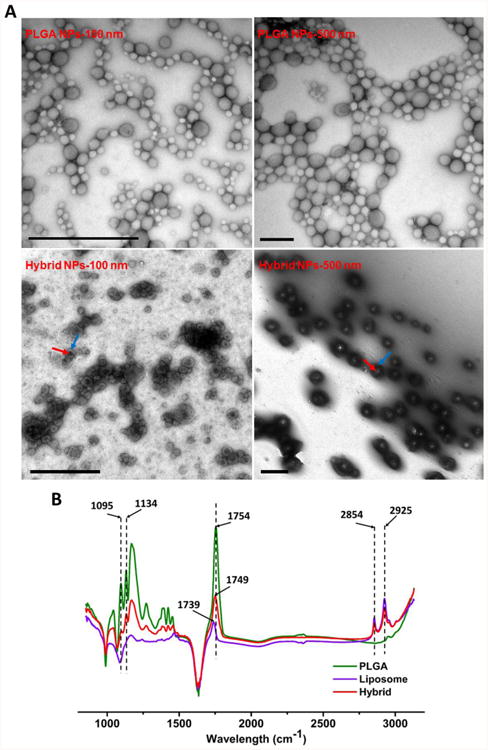
Characterization of lipid-polymeric hybrid NPs with different sizes. (A) Transmission electron microscopic images of poly(lactic-co-glycolic acid) (PLGA) and hybrid NPs with different average sizes. The red and blue arrows denote the PLGA core and lipid shell, respectively. The scale bars represent 1000 nm. (B) Fourier transform infrared spectra of PLGA NPs, liposome NPs, and lipid-polymeric hybrid NPs.