
Figure 6.
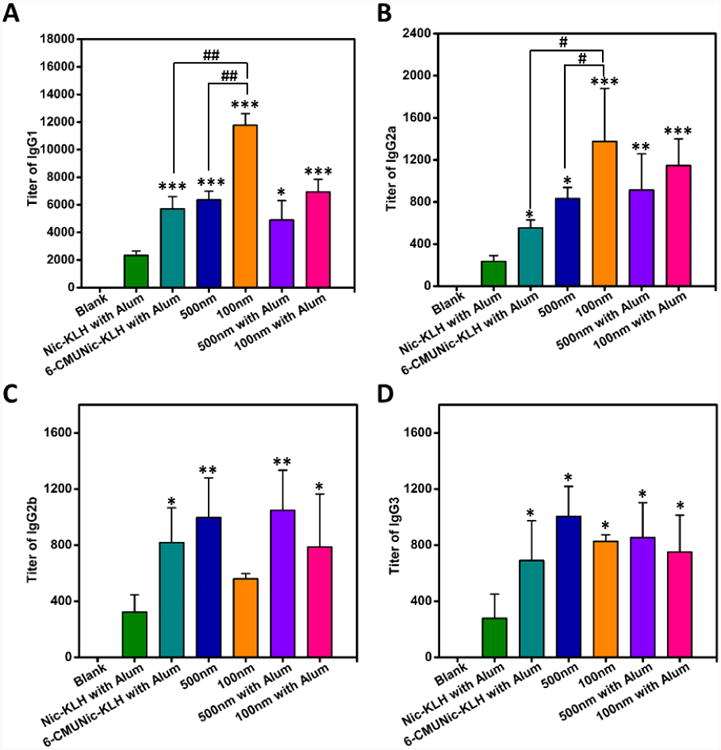
Distribution of IgG subclasses generated by immunization with nicotine vaccines. (A) IgG1; (B) IgG2a; (C) IgG2b; (D) IgG3. In the blank group, mice were injected with phosphate-buffered saline as the negative control. Comparisons among groups were analyzed by one-way ANOVA followed by Tukey's HSD test. Data are expressed as means ± SD. Significantly different compared to the Nic-KLH with alum groups: *p < 0.05, **p < 0.01, ***p < 0.001. Significantly different: #p < 0.05, ##p < 0.01.