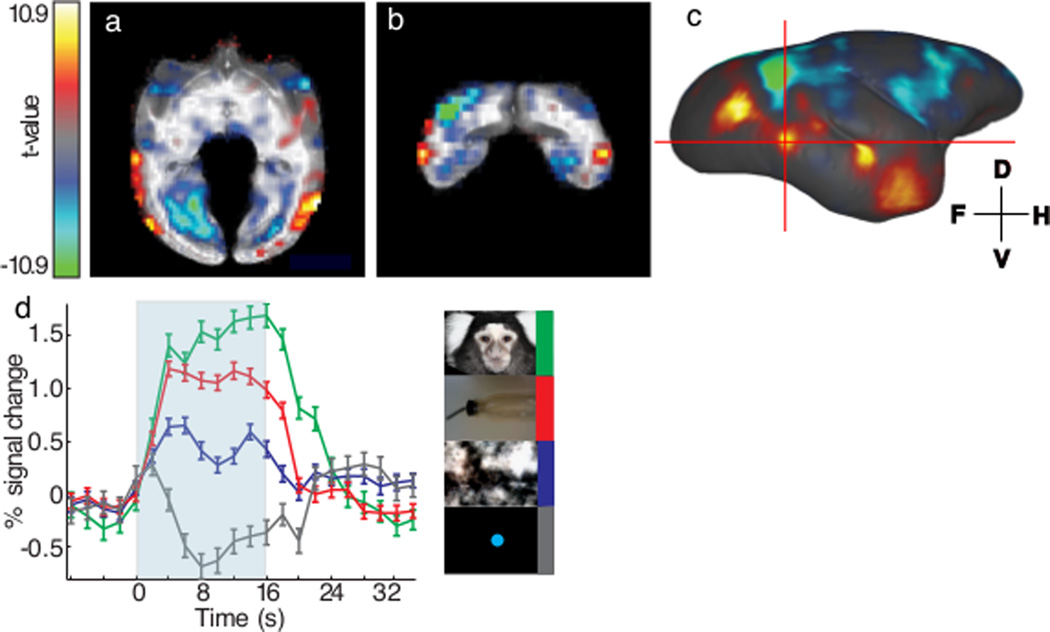
Figure 8.
BOLD fMRI activation maps and time courses of awake marmosets acquired using the 8-channel embedded arrays. Sub-figure (a) and (b) showed axial and coronal view of the fMRI statistical t-value map in the right hemisphere of one representative marmoset. Significant activation (face vs. object) could be detected in the occipitotemporal cortex. Color scale was ranging from t = 10.9 to t = −10.9 with alpha-channel (transparency) denoted the significance as well and no threshold was used. Area with red-yellow color meant higher BOLD response in face visual stimuli; area with blue-green color meant higher BOLD response in object visual stimuli. Activation map was further surface rendered to visualize the face patches in (c). Five distinct patches were discriminated with the upper-right one being the weakest and seemed discrete. The red crosshair represented two cross-sections of 8a and 8b. The intersection point was the center of one face patch and its time courses of four visual stimuli were plotted in (d). Voxels with t-value > 5 for the contrast between face and fixation dot were clustered together for averaging. BOLD response of four visual stimuli, faces (green), objects/body parts (red), spatial/frequency -scrambled face (blue), and fixation dot (gray), were plotted against 32-s period. Significant BOLD responses were observed in all visual stimuli for 16-s, except fixation dot, which only activated for a short period of time. Small (<0.5%), but significant, BOLD response difference between face and object/body parts visual stimuli was found in this face patch and was true for all other four face patches reported previously.

