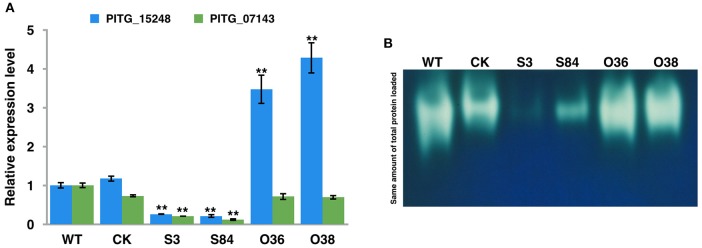
Figure 11.
PiLLP-silenced transformants with reduced catalase genes expression level and lower catalase activities. (A) The expression levels of two catalase genes (PITG_15248 and PITG_07143) in WT, CK, and transformants (S3, S84, O36, and O38). The qRT-PCR assay was performed using cDNAs synthesized from mycelial RNAs of different isolates (WT, CK, STs and OTs). The levels of PITG_15248 or PITG_07143 were determined relative to that of ef1, and the expression level of WT was used as a reference (value, 1.0). (B) In-gel assay of catalase activity. Equal amounts of total protein (20 μg) of different isolates (WT, CK, STs, and OTs) were loaded into Native-PAGE. The gel was immersed in 7 mM H2O2 for 10 min after electrophoresis, and then incubated in a 1/1 mixture of freshly prepared 1% potassium hexacyanoferrate (III) and 1% iron (III) chloride hexahydrate. Blue color was observed in the gel except at zones where H2O2 was decomposed by catalases. Three replicates were used for each treatment in these tests and the whole experiment was repeated with a different set of biological samples. Bars represent the standard deviation of three replicates. Statistical significance was analyzed using Student's t-test between WT and each transformant (**P < 0.01).

