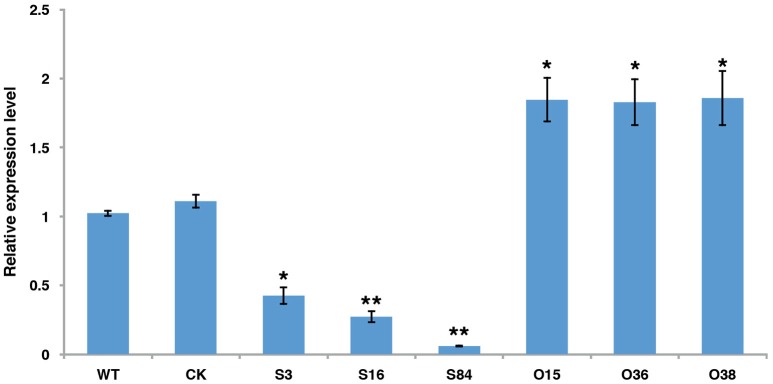
Figure 3.
The expression levels of PiLLP in WT, CK, and the PiLLP transformants (S3, S16, S84, O15, O36, and O38). qRT-PCR assay was performed using cDNAs synthesized from mycelial RNAs of different isolates. The level of PiLLP expression was determined relative to that of ef1, and WT was used as a reference (value, 1.0). Three replicates were used for each treatment and the whole experiment was repeated with a different set of biological samples. Bars represent the standard deviation of three replicates. Statistical significance was analyzed using Student's t-test between WT and each transformant (*P < 0.05, **P < 0.01).

