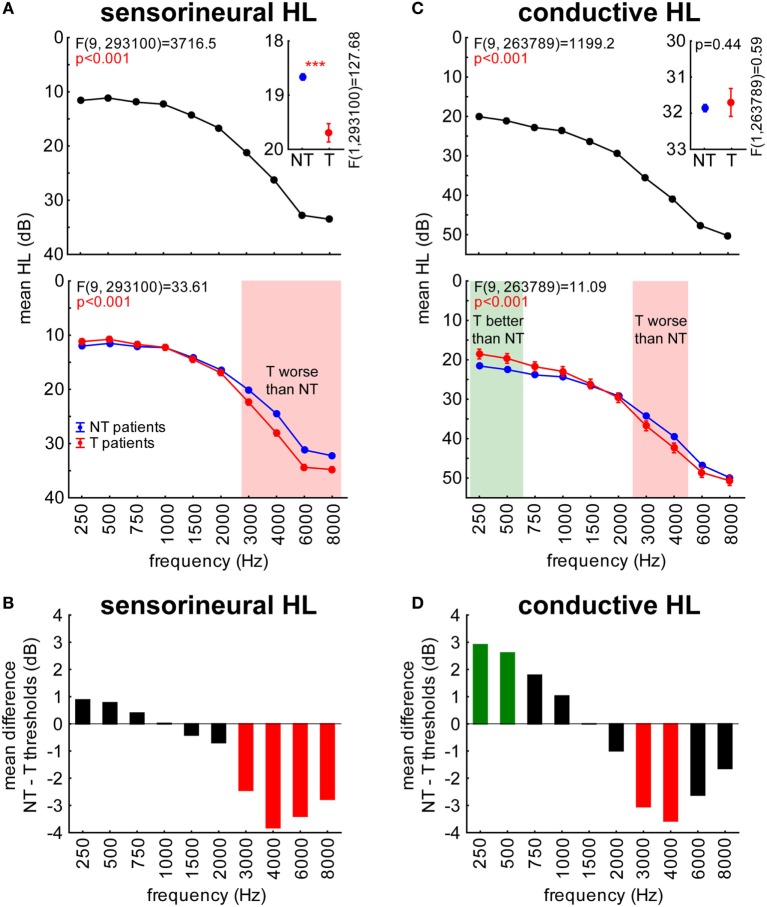
Figure 2.
Hearing loss (HL in decibel) in sensorineural (A,B) and conductive HL (C,D) patients. Symbols as in Figure 1. (A,C) Red areas indicate frequencies where T patients exhibit higher hearing thresholds compared to NT patients, the green area indicates frequencies where T patients show lower thresholds than NT patients (Tukey post hoc tests). (B,D) Red bars indicate significantly higher thresholds, green bars significantly lower thresholds.

