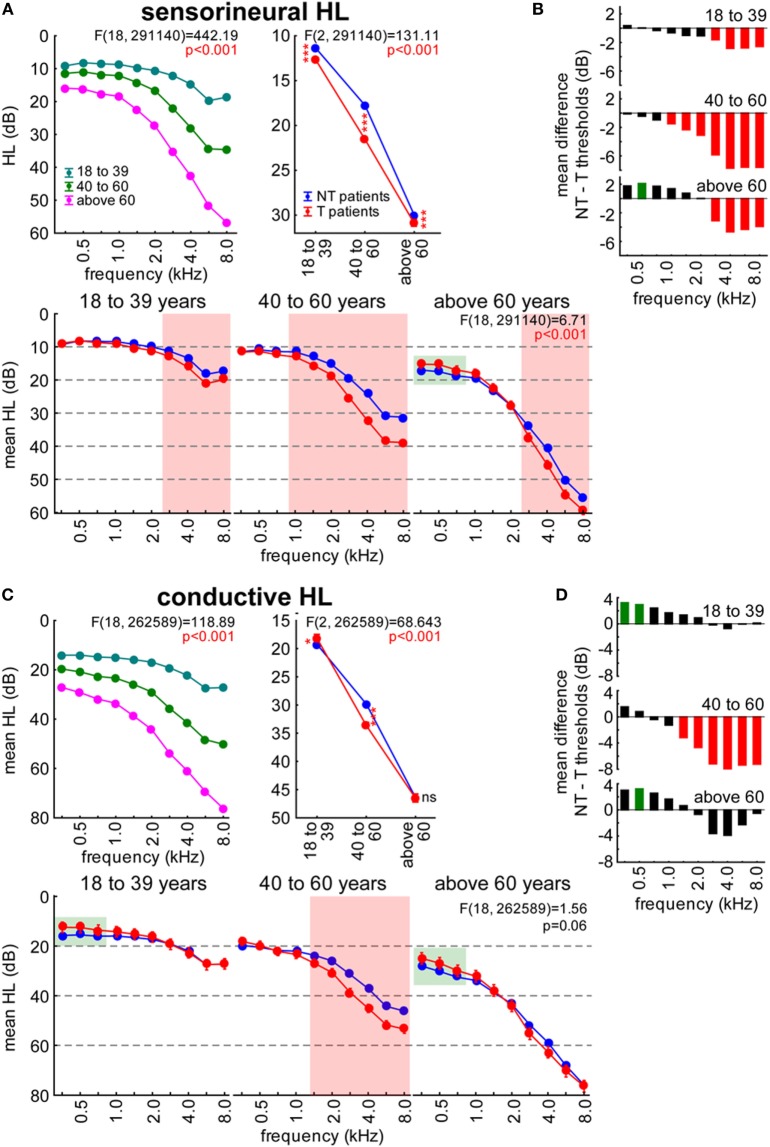
Figure 3.
Age dependency of hearing loss (HL in decibel) in sensorineural (A,B) and conductive HL (C,D) patients. (A,C) show the interaction plots of the 3-factorial ANOVAs of HL with factors age, patient group, and frequency. Asterisks depict significance levels of the Tukey post hoc tests in the interaction plot of age X patient group: ns, not significant, *p < 0.05, ***p < 0.001. Red shaded areas indicate frequencies with T patients exhibiting higher hearing thresholds compared to NT patients (Tukey post hoc tests separately for each frequency). Green shaded areas indicate frequency ranges (low: <1 kHz, mid: <4 kHz, high: ≥4 kHz) with T patients exhibiting lower hearing thresholds compared to NT patients (2-factorial ANOVAs for frequency ranges and patient groups). (B,D) give the mean HL difference of NT and T patients with red bars indicating significantly higher thresholds, green bars significantly lower thresholds in T patients compared to NT patients.

