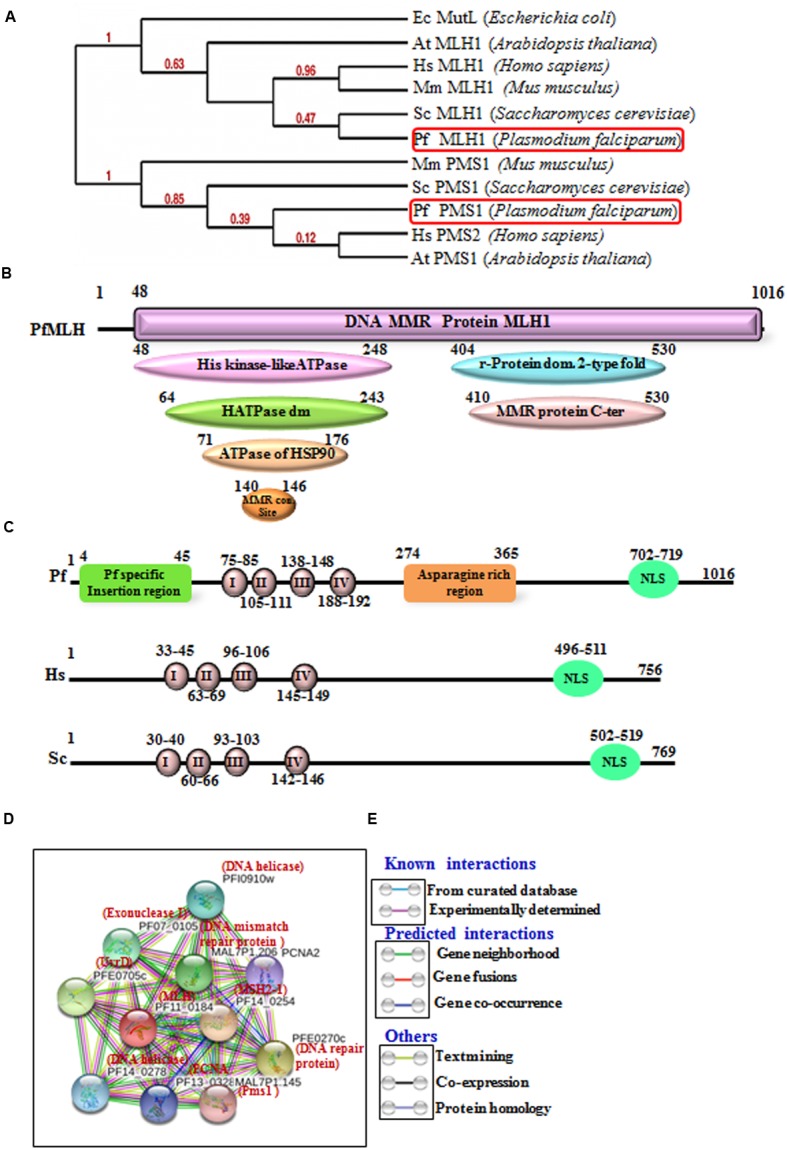
FIGURE 1.

(A) The phylogenetic tree was obtained using the maximum likelihood method. The numbers in the tree show the distance between different sequences. The tree is drawn to scale with branch lengths (next to each branch) in the same units as those of the evolutionary distances used to infer the phylogenetic tree. (B) Detailed graphical organization of P. flaciparum MutL Homolog (MLH) domains with their specific position in the protein obtained by in silico tool/InterProScan; (C) Schematic comparison of conserved motifs of P. flaciparum MLH with human and Yeast. (D) Interacting protein prediction of PfMLH using STRING v10 database. (E) Explanation of interactions shown in (D).
