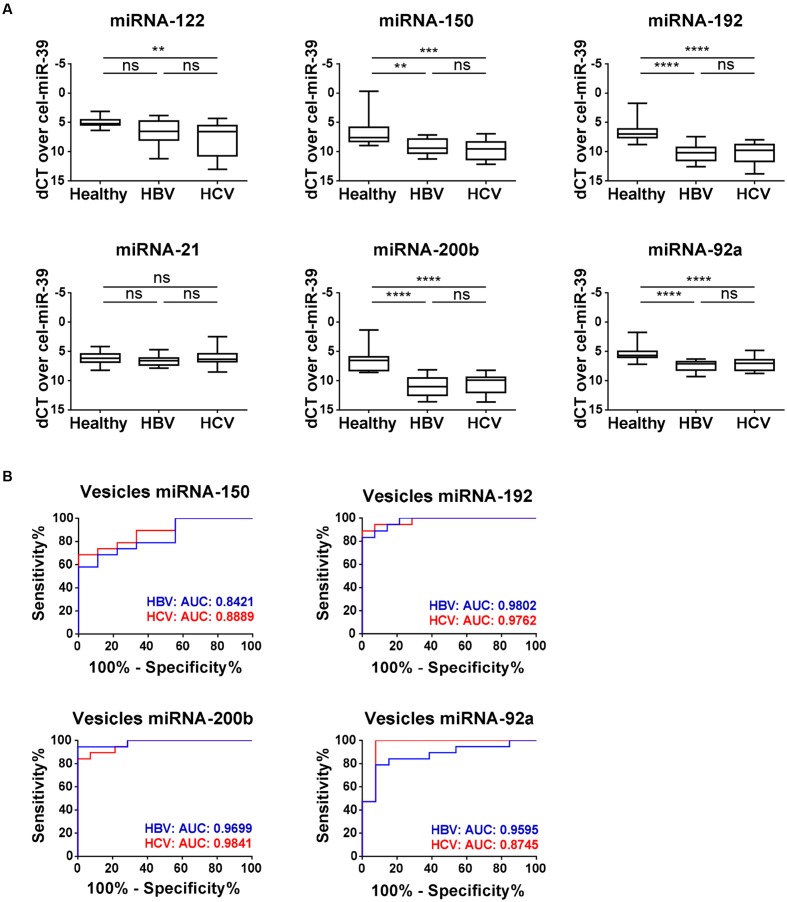
FIGURE 3.
Expression of vesicle-associated miRNA-150, -192, -200b, -92a during early stage HBV- and HCV-induced fibrosis. (A) The levels of plasma vesicle-associated miRNA-122, -150, -192, -21, -200b, and -92a were measured by real-time quantitative PCR, and obtained Ct levels were normalized by use of spiked-in cel-miRNA-39. (B) Curves of receiver operating characteristic (ROC) analysis using the differentially expressed vesicle-associated miRNA-150, -192, -200b, and -92a for discriminating early stage HBV (blue) and HCV (red) fibrotic patients versus healthy controls. ∗∗P < 0.01; ∗∗∗P < 0.001; ∗∗∗∗P < 0.0001.

