Figure 5.
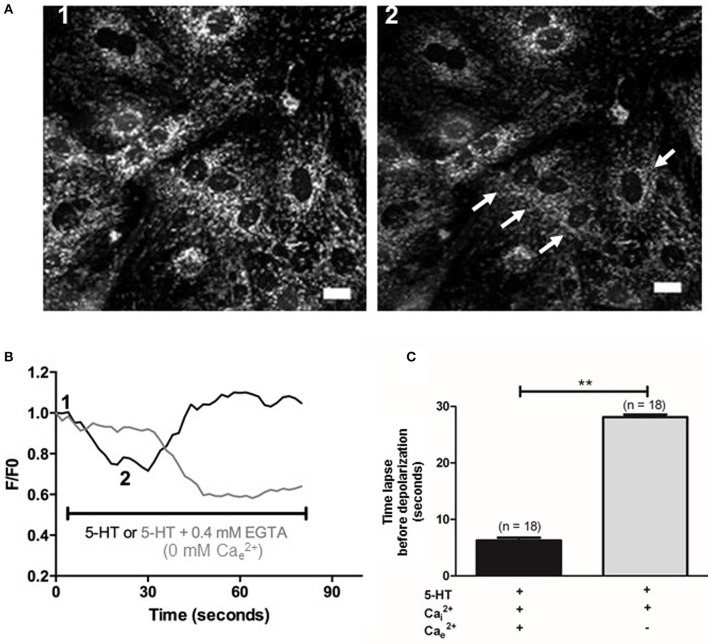
Effect of 5-HT on mitochondrial membrane potential in PASMC. (A) Images 1 and 2 represent mitochondrial fluorescence before and after application of 5-HT (100 μM). White arrows indicate cells with the highest decrease in fluorescence following 5-HT stimulation. Scale bars are 20 μm. (B) Typical traces of mitochondrial membrane potential in response to 5-HT in the presence of 2 mM (black line) or in the absence of and the presence of 0.4 mM EGTA (light gray line). One and two indicate the F/F0 value for one cell from the corresponding images 1 and 2 shown in (A). F/Fo is the ratio of the fluorescence values F over the basal fluorescence F0 (before application of the agonists). (C) Values of the time lapse between bath-application of 5-HT and the beginning of the mitochondrial membrane potential variation in the presence and in the absence of extracellular Ca2+ (black and light gray columns respectively). Data are expressed as mean ± SEM. **means a significant difference for P < 0.01. n is the number of cells tested.

