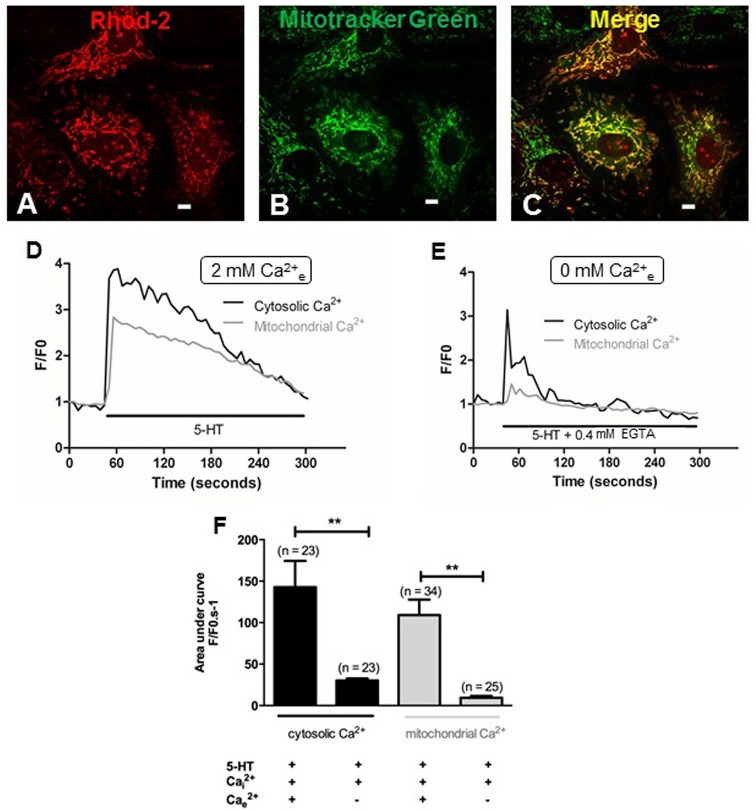
Figure 6.
Role of extracellular calcium in the cytosolic and mitochondrial calcium signals induced by 5-HT. (A,B) Show PASMC loaded with rhod-2 (1 μM) and mitotracker green (400 nM) respectively. (C) Is the merge of (A,B), illustrating colocalization of rhod-2 and mitotracker green as an index of the mitochondrial network in yellow. Scale bars are 20 μm. Typical traces of simultaneous recordings of cytosolic (black lines) and mitochondrial (light gray lines) Ca2+ levels in response to 5-HT (100 μM) in PASMC are shown in the presence or in the absence of extracellular Ca2+ (D and E respectively). (F) Histograms of cytosolic and mitochondrial calcium variations (black and light gray columns respectively) induced by 5-HT (100 μM) in the presence and in the absence of extracellular Ca2+. n is the number of cells. **means a significant difference for P < 0.01.

