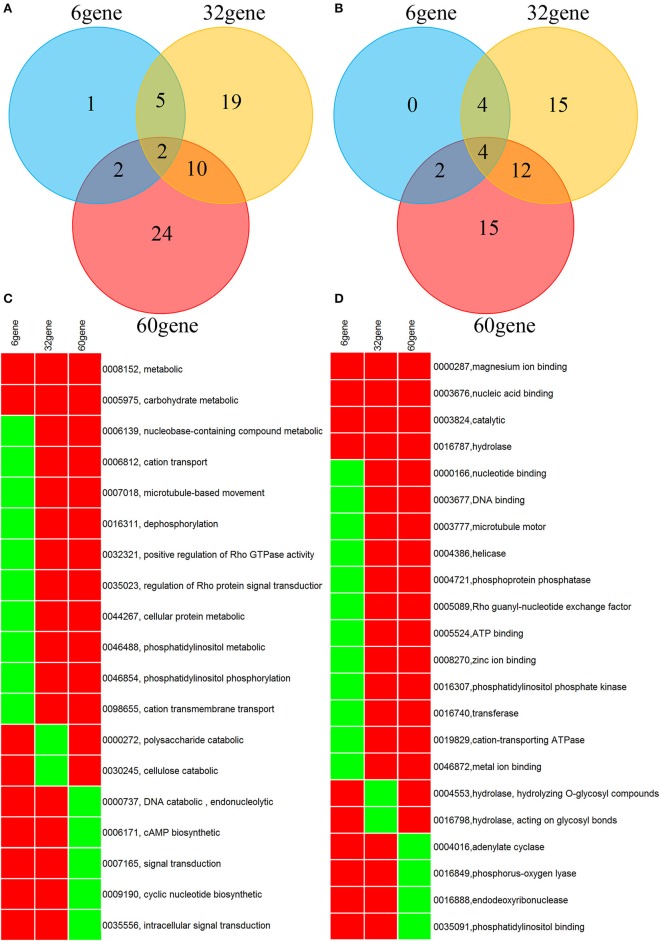
Figure 3.
Venn diagram and heatmap showing GO annotation of the genes derived from SNP association (32 gene), Wilcoxon rank sum test (6 gene), and counts of NSY SNP > 10 (60 gene). (A,B) Venn diagram for GO categories of biological process and molecular function, respectively. (C,D) Heatmap for GO categories of biological process and molecular function, respectively. Only GO terms present in at least 2 of the 3 gene lists are shown. Rows represent GO terms and columns represent genes derived from the aforementioned 3 methods. Red indicates the presence of the GO term in the corresponding gene list, and green indicates absence. The labeling of each row represents both GO ID and its description.

