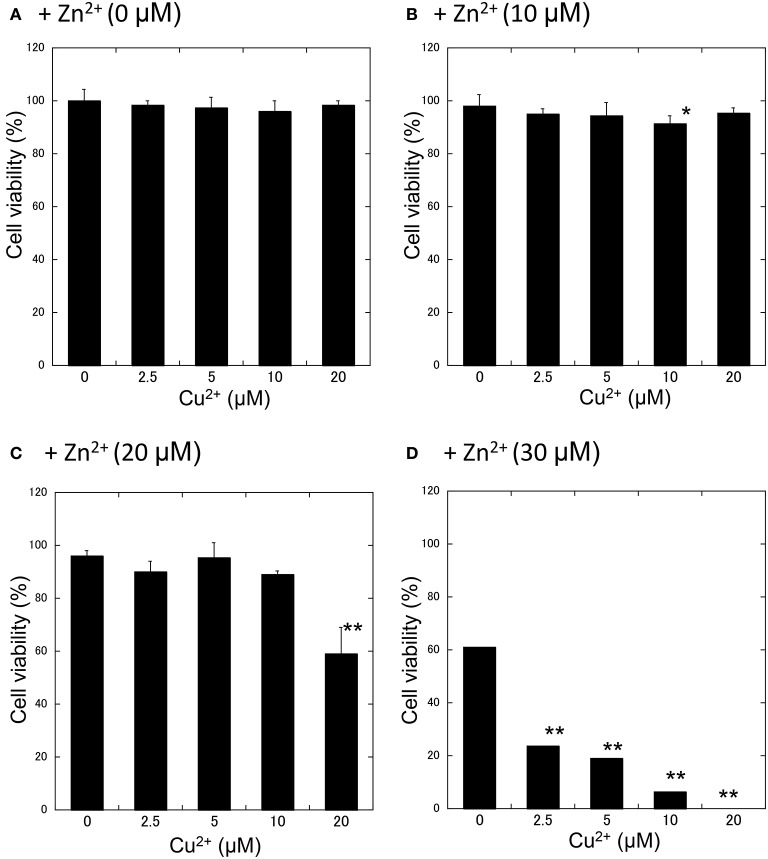
Figure 3.
Effects of Cu2+ on Zn2+-induced neurotoxicity. Various concentrations of CuCl2 (0~20 μM) without ZnCl2 (A) or with 10 μM (B), 20 μM (C), or 30 μM ZnCl2 (D) were administered to GT1-7 cells. After 24 h, cell viability was determined using the WST-8 method. Six wells were exposed to the same experimental conditions (n = 6). Data are presented as means ± SD. Experiments were replicated at least two times. *p < 0.05, **p < 0.01 vs. CuCl2 (0 μM).

