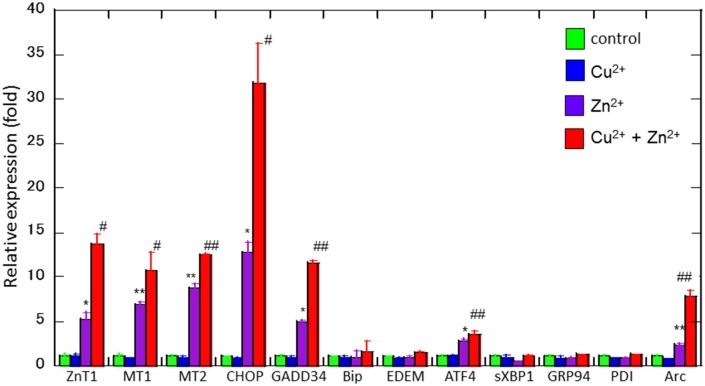
Figure 4.
Effects of Cu2+ on Zn2+-induced gene expression. Expression levels of CHOP, GADD34, Arc, Bip, ATF4, EDEM, sXBP1, GRP94, PDI, ZnT-1, MT1, and MT2 were analyzed using real-time RT–PCR. Gene expression levels were normalized with GAPDH. Data are presented as means ± SD (n = 3). Experiments were replicated at least two times. *p < 0.05, **p < 0.01 compared with control; #p < 0.05, ##p < 0.01 compared with Zn2+.

