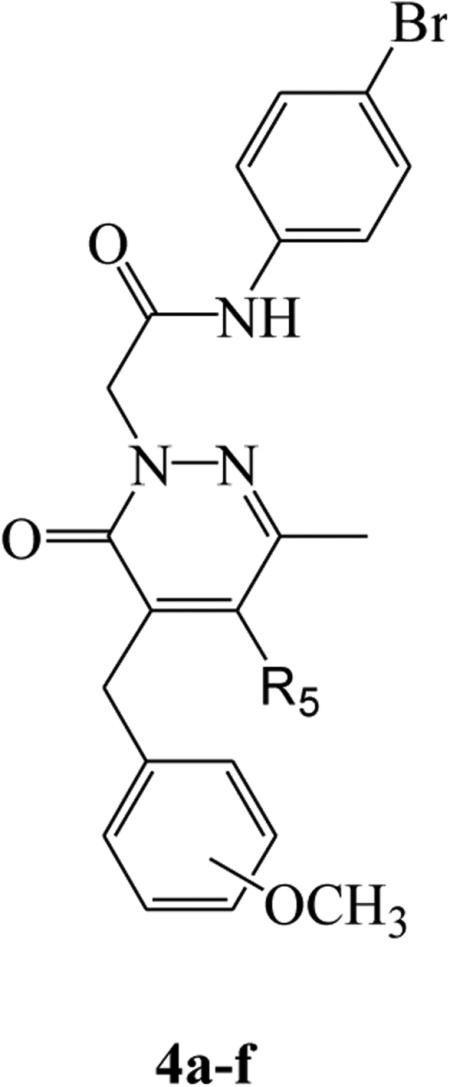
Table 1.
Activity of 4-benzyl-5-substituted pyridazinones 4a-f in human neutrophils and FPR-transfected HL60 cell

| ||||||
|---|---|---|---|---|---|---|
| Compd | R5 | OCH3 | Ca2+ flux | |||
| human neutrophils | FPR1-HL60 | FPR2-HL60 | FPR3-HL60 | |||
| EC50 (μM) and efficacy (%)[a] | ||||||
| 4a | CH3 | m | 0.006 ± 0.002 (150) | 0.019 ± 0.005 (85) | 0.043 ± 0.016 (80) | 0.040 ± 0.011 (165) |
| 4b | CH3 | p | 0.27 ± 0.025 (140) | 0.9 ± 0.033 (60) | 0.013 ± 0.003 (95) | 0.13 ± 0.032 (100) |
| 4c | C2H5 | m | 1.2 ± 0.3 (100) | 3.2 ± 0.6 (120) | 1.9 ± 0.41 (100) | 4.1 ± 1.7 (100) |
| 4d | C3H5 | m | 3.2 ± 1.2 (70) | 2.2 ± 0.5 (115) | 4.6 ± 1.3 (90) | 3.4 ± 0.76 (65) |
| 4e | C4H9 | m | 2.7 ± 0.7 (25) | N.A.[b] | 15.7 ± 4.2 (90) | N.A. |
| 4f | C6H5 | m | 5.4 ± 0.26 (100) | 2.2 ± 0.62 (160) | N.A. | N.A. |
EC50 values represent the average of means from three independent experiments and were determined by nonlinear regression analysis of the concentration-response curves (5-6 points) generated using GraphPad Prism 5 with 95% confidential interval (p < 0.05). Efficacy is expressed as % of the response induced by 5 nM fMLF (FPR1), 5 nM WKYMVm (FPR2), or 10 nM WKYMVM (FPR3).
N.A., no activity (no response was observed during the first 2 min after addition of compounds under investigation) considering the limits of efficacy > 20% and EC50 < 50 μM.
