Figure 2.

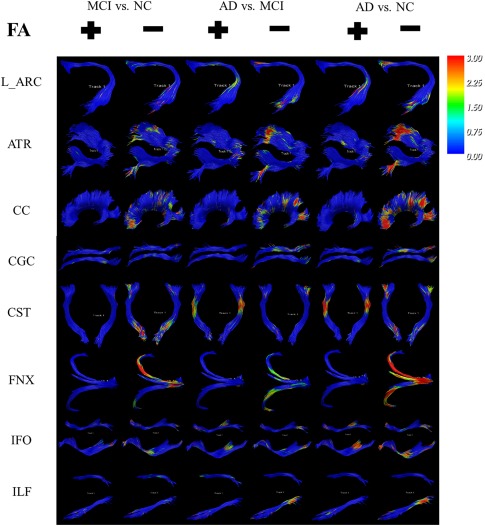
The 3D FDR corrected color maps of the 18 WM tracts reveal differences in FA values in pairwise comparisons of the three diagnostic groups. [Color figure can be viewed at http://wileyonlinelibrary.com]

The 3D FDR corrected color maps of the 18 WM tracts reveal differences in FA values in pairwise comparisons of the three diagnostic groups. [Color figure can be viewed at http://wileyonlinelibrary.com]