
Figure 3.
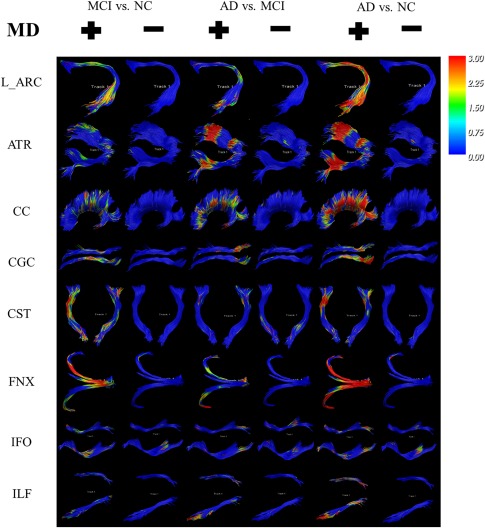
The 3D FDR corrected color maps of the 18 WM tracts reveal differences in MD values in pairwise comparisons of the three diagnostic groups. [Color figure can be viewed at http://wileyonlinelibrary.com]
Official websites use .gov
A
.gov website belongs to an official
government organization in the United States.
Secure .gov websites use HTTPS
A lock (
) or https:// means you've safely
connected to the .gov website. Share sensitive
information only on official, secure websites.
The 3D FDR corrected color maps of the 18 WM tracts reveal differences in MD values in pairwise comparisons of the three diagnostic groups. [Color figure can be viewed at http://wileyonlinelibrary.com]