
Figure 6.
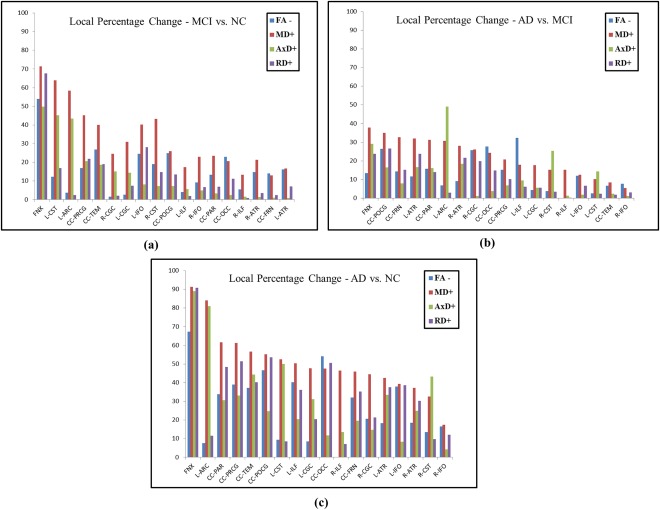
The percentages of points in the 18 WM tracts with statistically significantly lower FA and elevated MD/AxD/RD between (a) MCI versus NC, (b) AD versus MCI, and (c) AD versus NC (the latter group is the baseline), with FADTTS (FDR corrected P < 0.05). The tracts are ranked in order from the highest percentage to the lowest for MD. [Color figure can be viewed at http://wileyonlinelibrary.com]