
Figure 9.
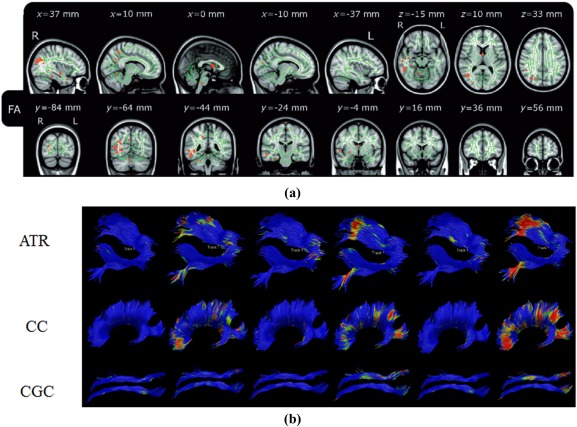
(a) An illustration of the TBSS results for reduced FA in AD patients [Acosta‐Cabronero et al., 2010]. (b) An illustration of our 3D TSA framework results on three WM tracts: anterior thalamic radiation (ATR), corpus callosum (CC), and cingulum (CGC) in AD. [Color figure can be viewed at http://wileyonlinelibrary.com]