
Figure 1. CLK2 is enriched in brown adipose tissue and regulated by feeding.
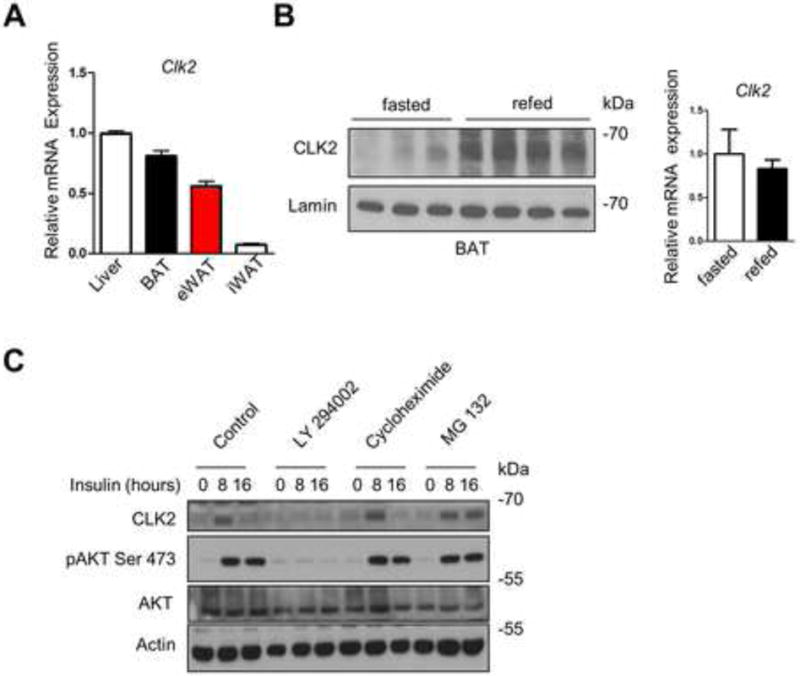
A) qRT-PCR analysis of CLK2 expression in tissue extracts of Clk2f/f mice as indicated (n=5). B) Western blots of BAT nuclear extracts from Clk2f/f mice after fasting (24h) or refeeding (12h) (left panel) and qRT-PCR analysis of BAT from Clk2f/f mice after fasting (24h) or refeeding (12) (right panel). C) Western blot of primary brown adipocytes treated with 100 nM insulin for 0, 8 or 16 hours and pre-treated as indicated. Data shown as mean ± SEM. Student’s t-test (2 data sets) or one-way-ANOVA (multiple data sets) were performed and p<0.05 was considered to be significant and indicated with *. (See also Figure S1)