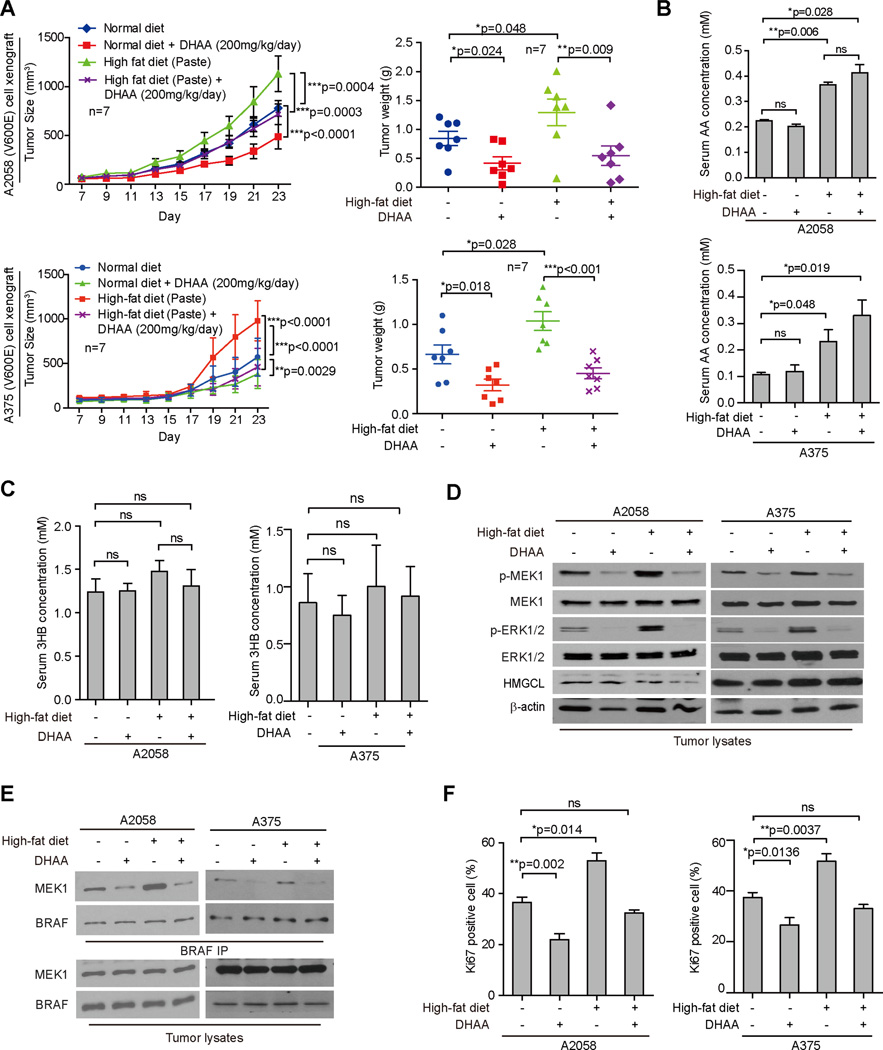
Figure 7. DHAA treatment reverses high-fat enhanced BRAF V600E tumor growth in xenograft nude mice.
(A) Tumor growth (left) and weight (right) of xenograft nude mice injected with BRAF V600E-positive human melanoma A375 (upper panels) an A2058 (bottom panels) cells that were fed with normal or high-fat diets followed by intraperitoneal injection with DHAA. Data are mean ± SEM for tumor growth and mean ± s.d. for tumor weight; p values were obtained by a two-way ANOVA test.
(B–C) AA (B) and 3HB (C) levels in serum harvested from xenograft mice. Data are mean ± s.d.; n=3; p values were obtained by a two-way ANOVA test for tumor growth rates and a two-tailed Student’s t test for tumor masses.
(D–E) Western blot results assessing MEK1 and ERK1/2 phosphorylation (D) and BRAF-MEK1 binding (E) in tumor tissue samples obtained from xenograft mice.
(F) Summarized results of IHC staining assay detecting Ki67-positive cells in tumor tissue samples from xenograft mice. Data are mean ± s.d.; p values were obtained by a two-tailed Student’s t test.
Also see Figure S7.

