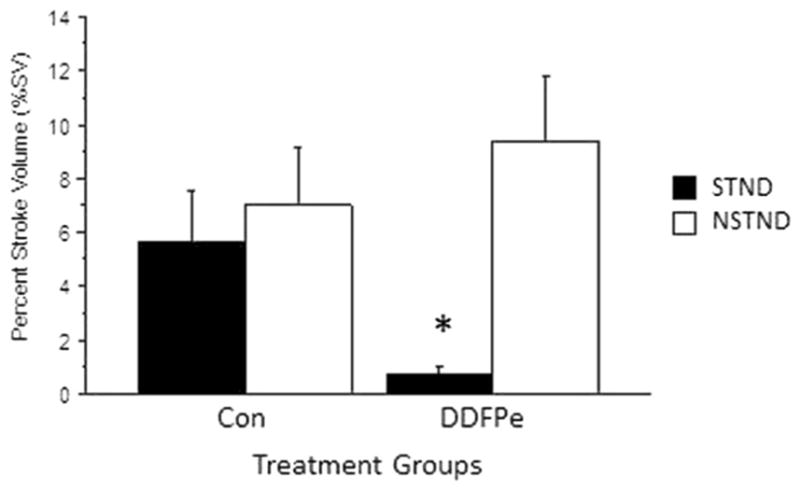
Fig. 4.

%SV for the DDFPe-STND group was improved compared to Con-STND (p = 0.016), DDFPe-NSTND (p = 0.001), and Con-NSTND (p = 0.01). In contrast, the DDFPe-NSTND group did not differ from controls Con-NSTND (p = NS) and Con-STND (p = NS). Mean ± SEM are shown. *Indicates significance at p ≤ 0.02 vs. other treatment groups
