Figure 8.
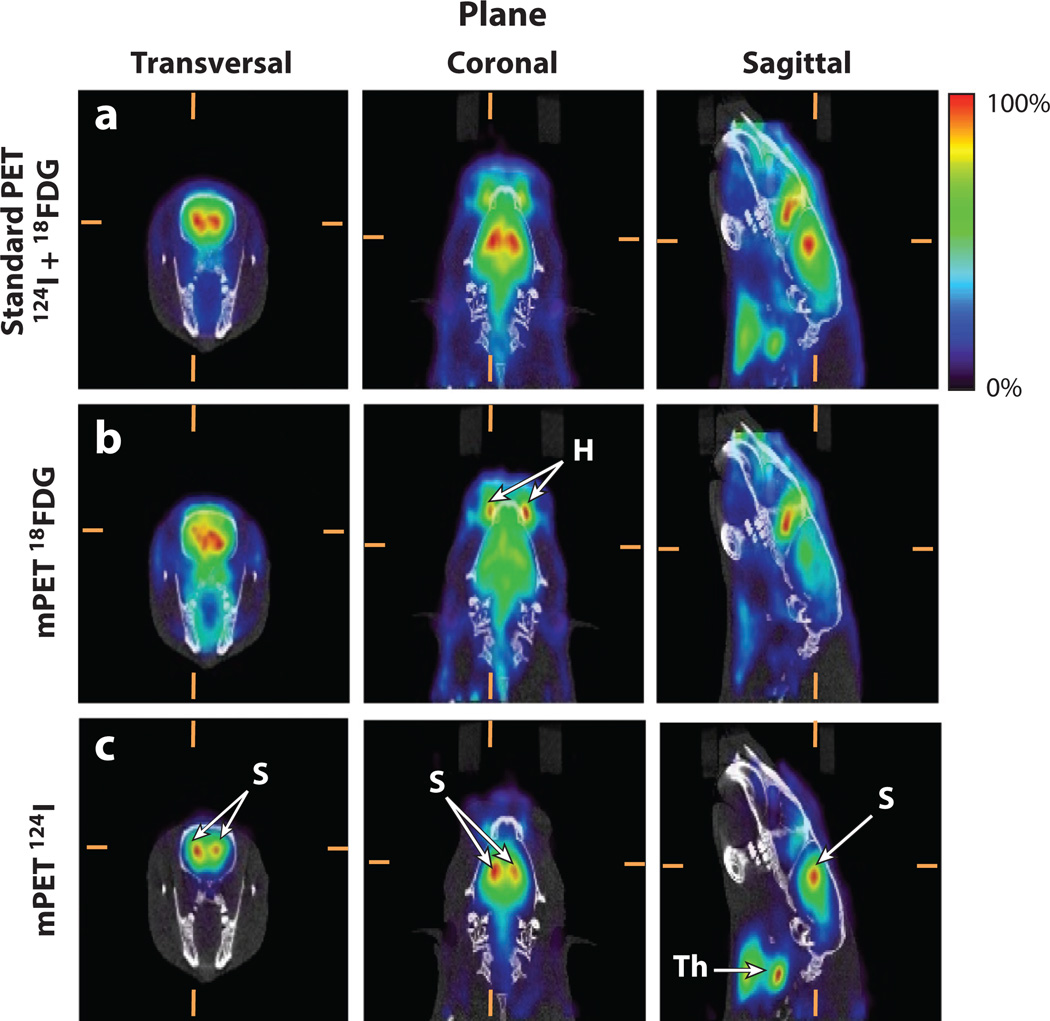
Multi-isotope in vivo brain positron emission tomography and computed tomography (PET–CT) imaging. All images show the same approximate anatomical slice in the three orthogonal views (columns). CT image values are represented using a gray scale, and PET image values are represented using a rainbow color scale. (Top row) Standard PET image (using only double coincidences) from a rat injected with iodine-124 (124I)-β-CIT (dopamine transporters) and 18FDG (glucose metabolism). Because standard PET data processing does not allow signal multiplexing, the combined signal from both radiotracers is shown as a single, mixed image. (Middle row) Separated 18FDG signal obtained by multiplexed PET (mPET) showing homogeneous uptake in the brain and a high, nonspecific uptake in the Harderian gland (H), which is typical of this radiotracer. (Bottom row) Separated 124I-β-CIT signal obtained by mPET showing specific, dopamine transporter binding in the striatum (S) and nonspecific uptake in the thyroid glands (Th). The top row shows the result of adding information from the middle and bottom rows; mPET is capable of separating both independent components. Images courtesy of Stephen Moore, Brigham and Women’s Hospital, Boston.

