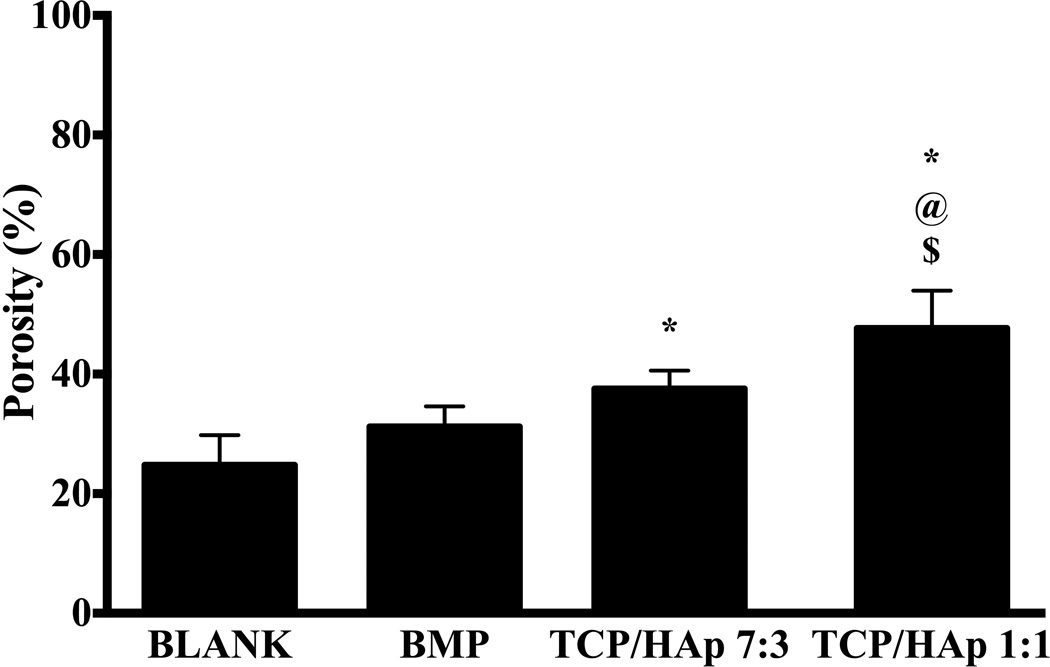
Figure 5.
Average porosities of different scaffold groups. All values are expressed as the average + standard deviation (n = 6). The TCP/HAp groups had significantly higher porosities than the BLANK and BMP controls. *significant difference from the BLANK negative control group, @significant difference from the BMP positive control group, and $significant difference from the TCP/HAp 7:3 group (p < 0.05).

