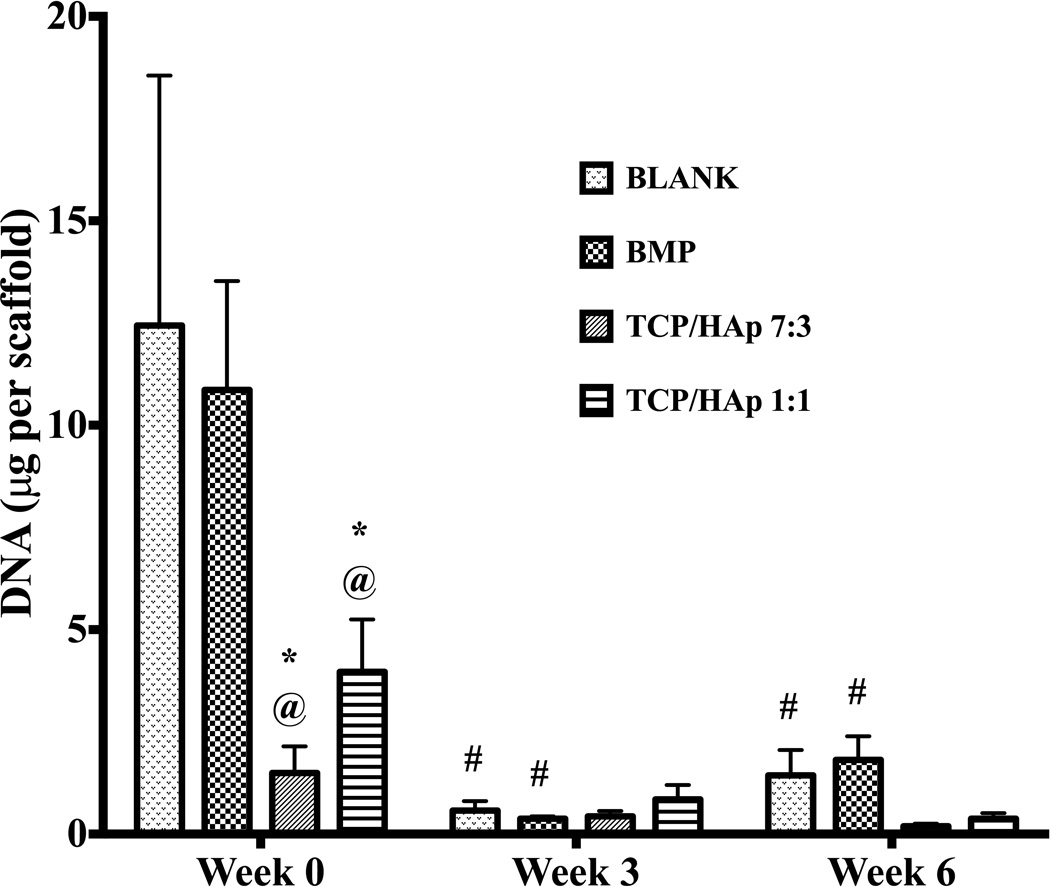
Figure 6.
Total DNA content as measured in the microsphere-based scaffolds over weeks 0, 3 and 6. All values are expressed as the average + standard deviation (n = 6). The TCP/HAp groups had significantly lower DNA content than the BLANK and BMP controls at week 0, while no significant differences were observed among the groups at later time points. *significant difference from the BLANK negative control group at same time point, @significant difference from the BMP positive control group at same time point, and #significant change from its value at week 0 (p < 0.05).

